One tool, two front doors
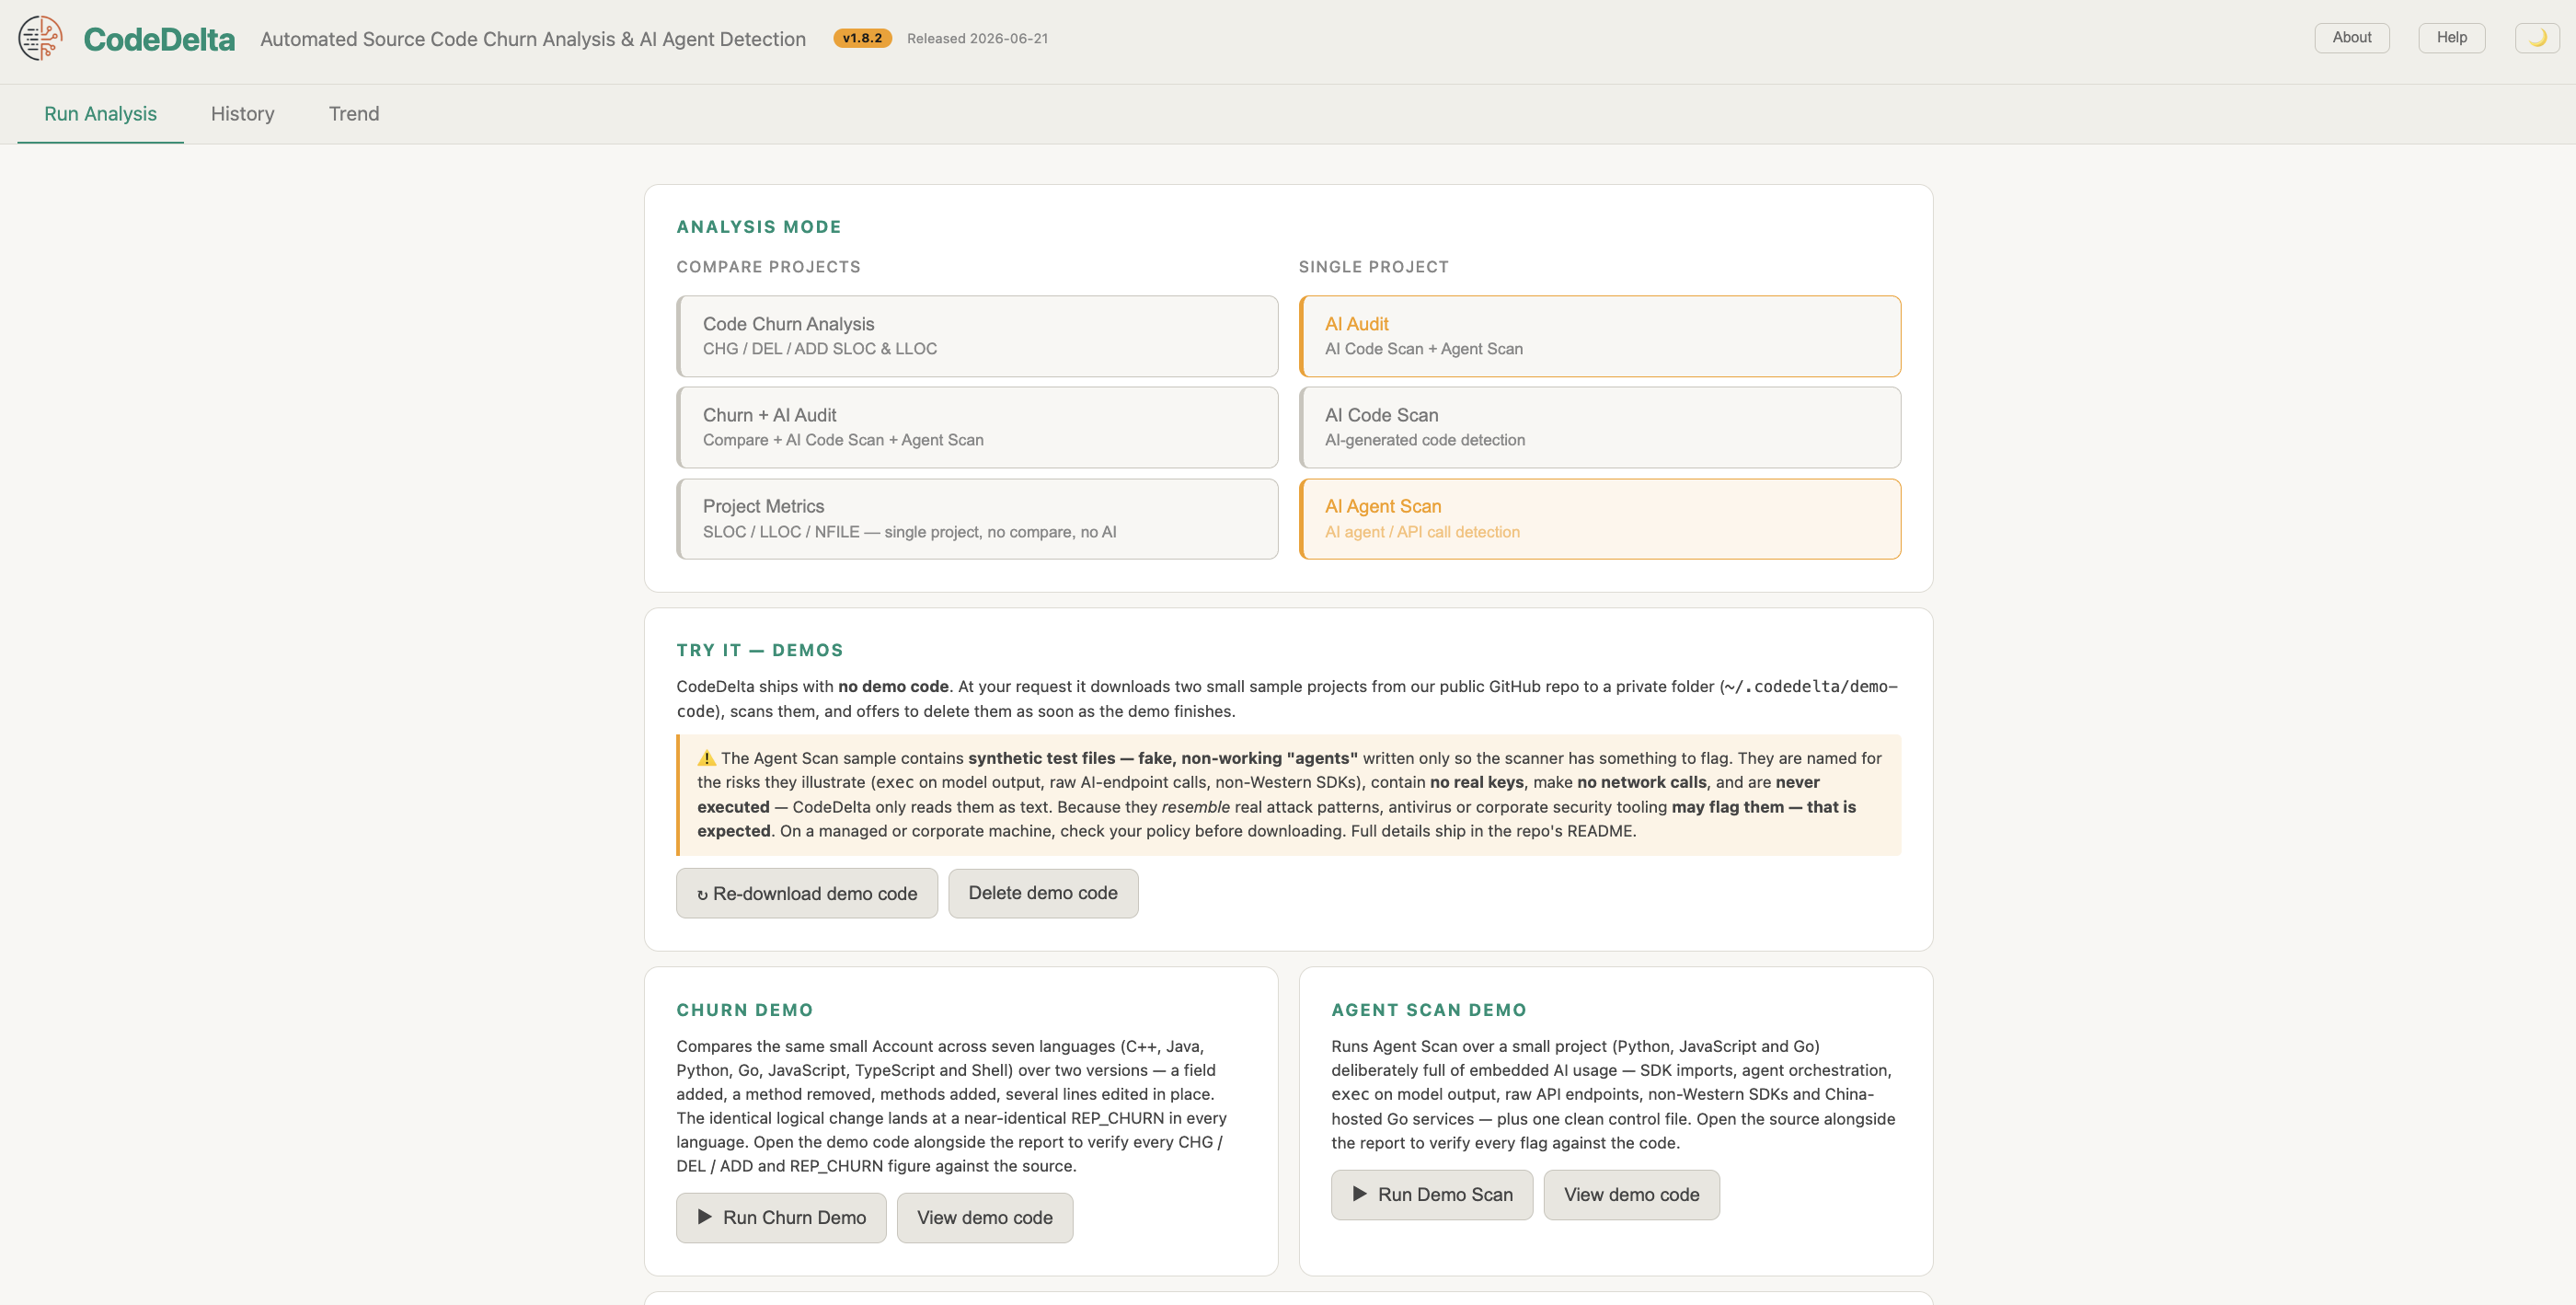
Everything the GUI does, the command line does — they run the same engine and write the same reports. Use the GUI to explore; use the command line when the scan should happen on its own: nightly, weekly, on a build server, or inside a quality system you already run. Nothing about the results changes with the door you came in through.
A scan in one line
The bundle gives you two commands. codedelta is the engine:
give it two versions of the code and it writes the churn reports. codedelta-gui scan
runs that same engine and can add the rest — the AI scans, the pass/fail gates and the
trend database. One thing to watch: the engine takes the OLD directory first, the batch
command takes the NEW one first.
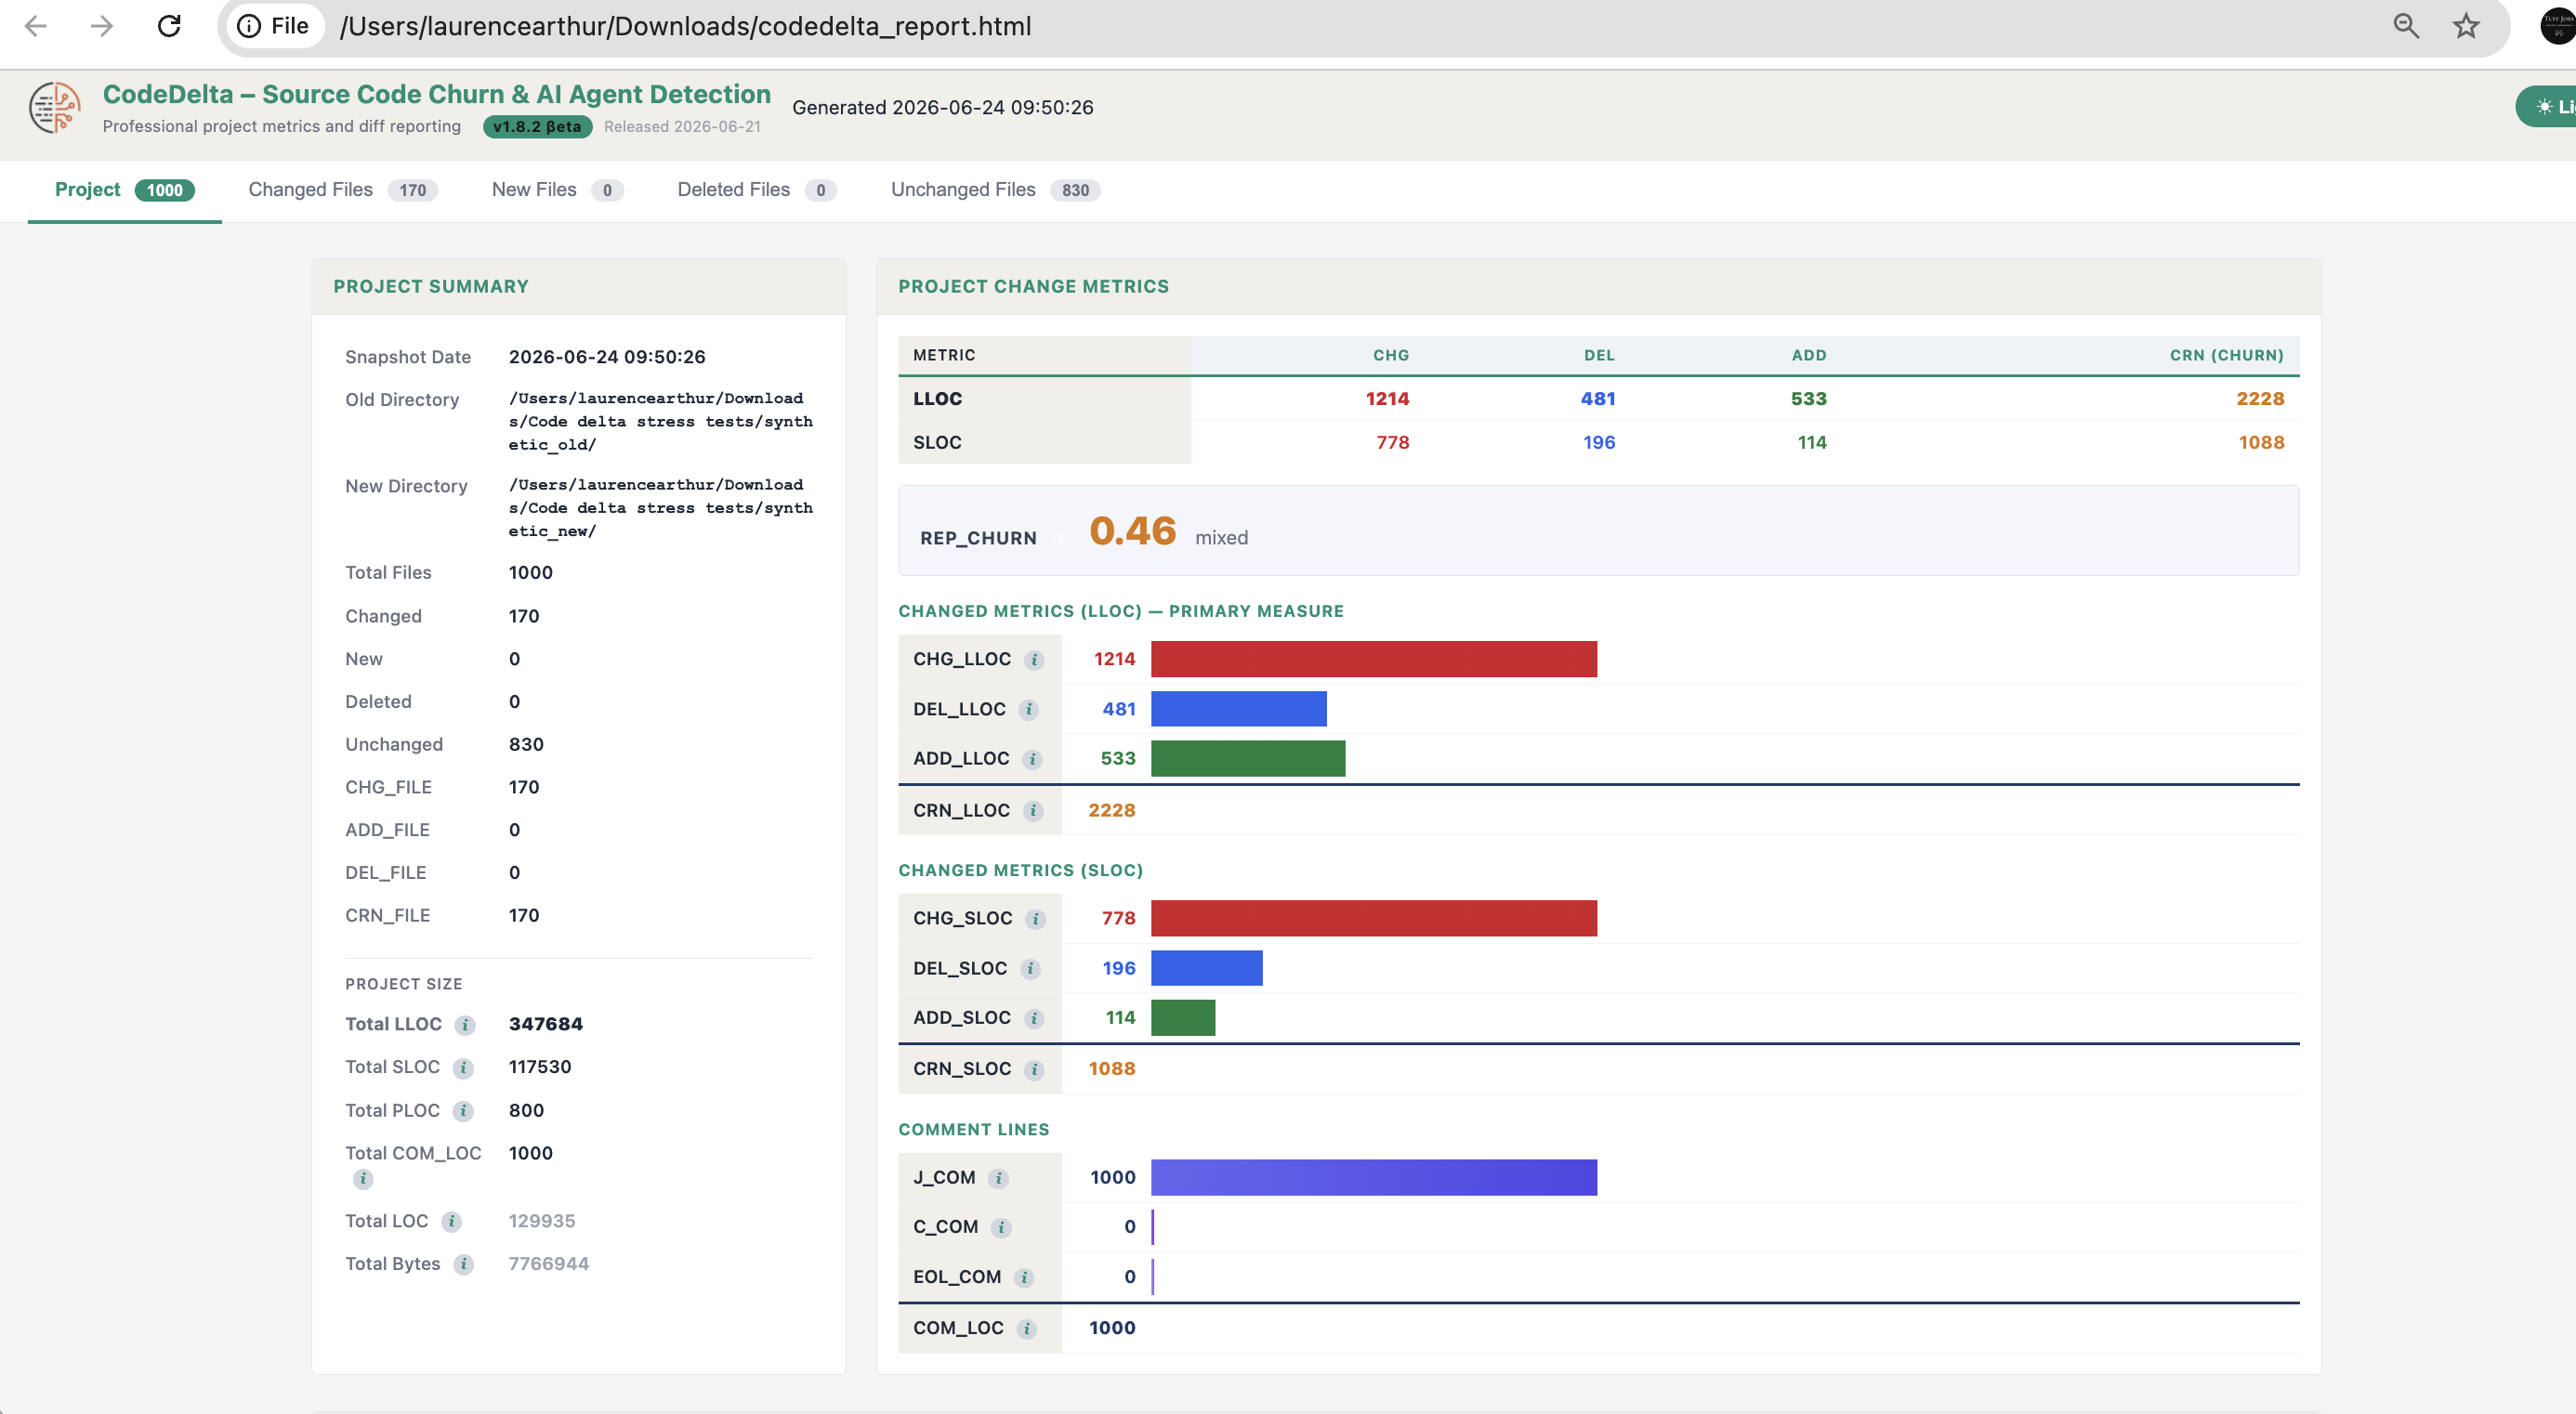
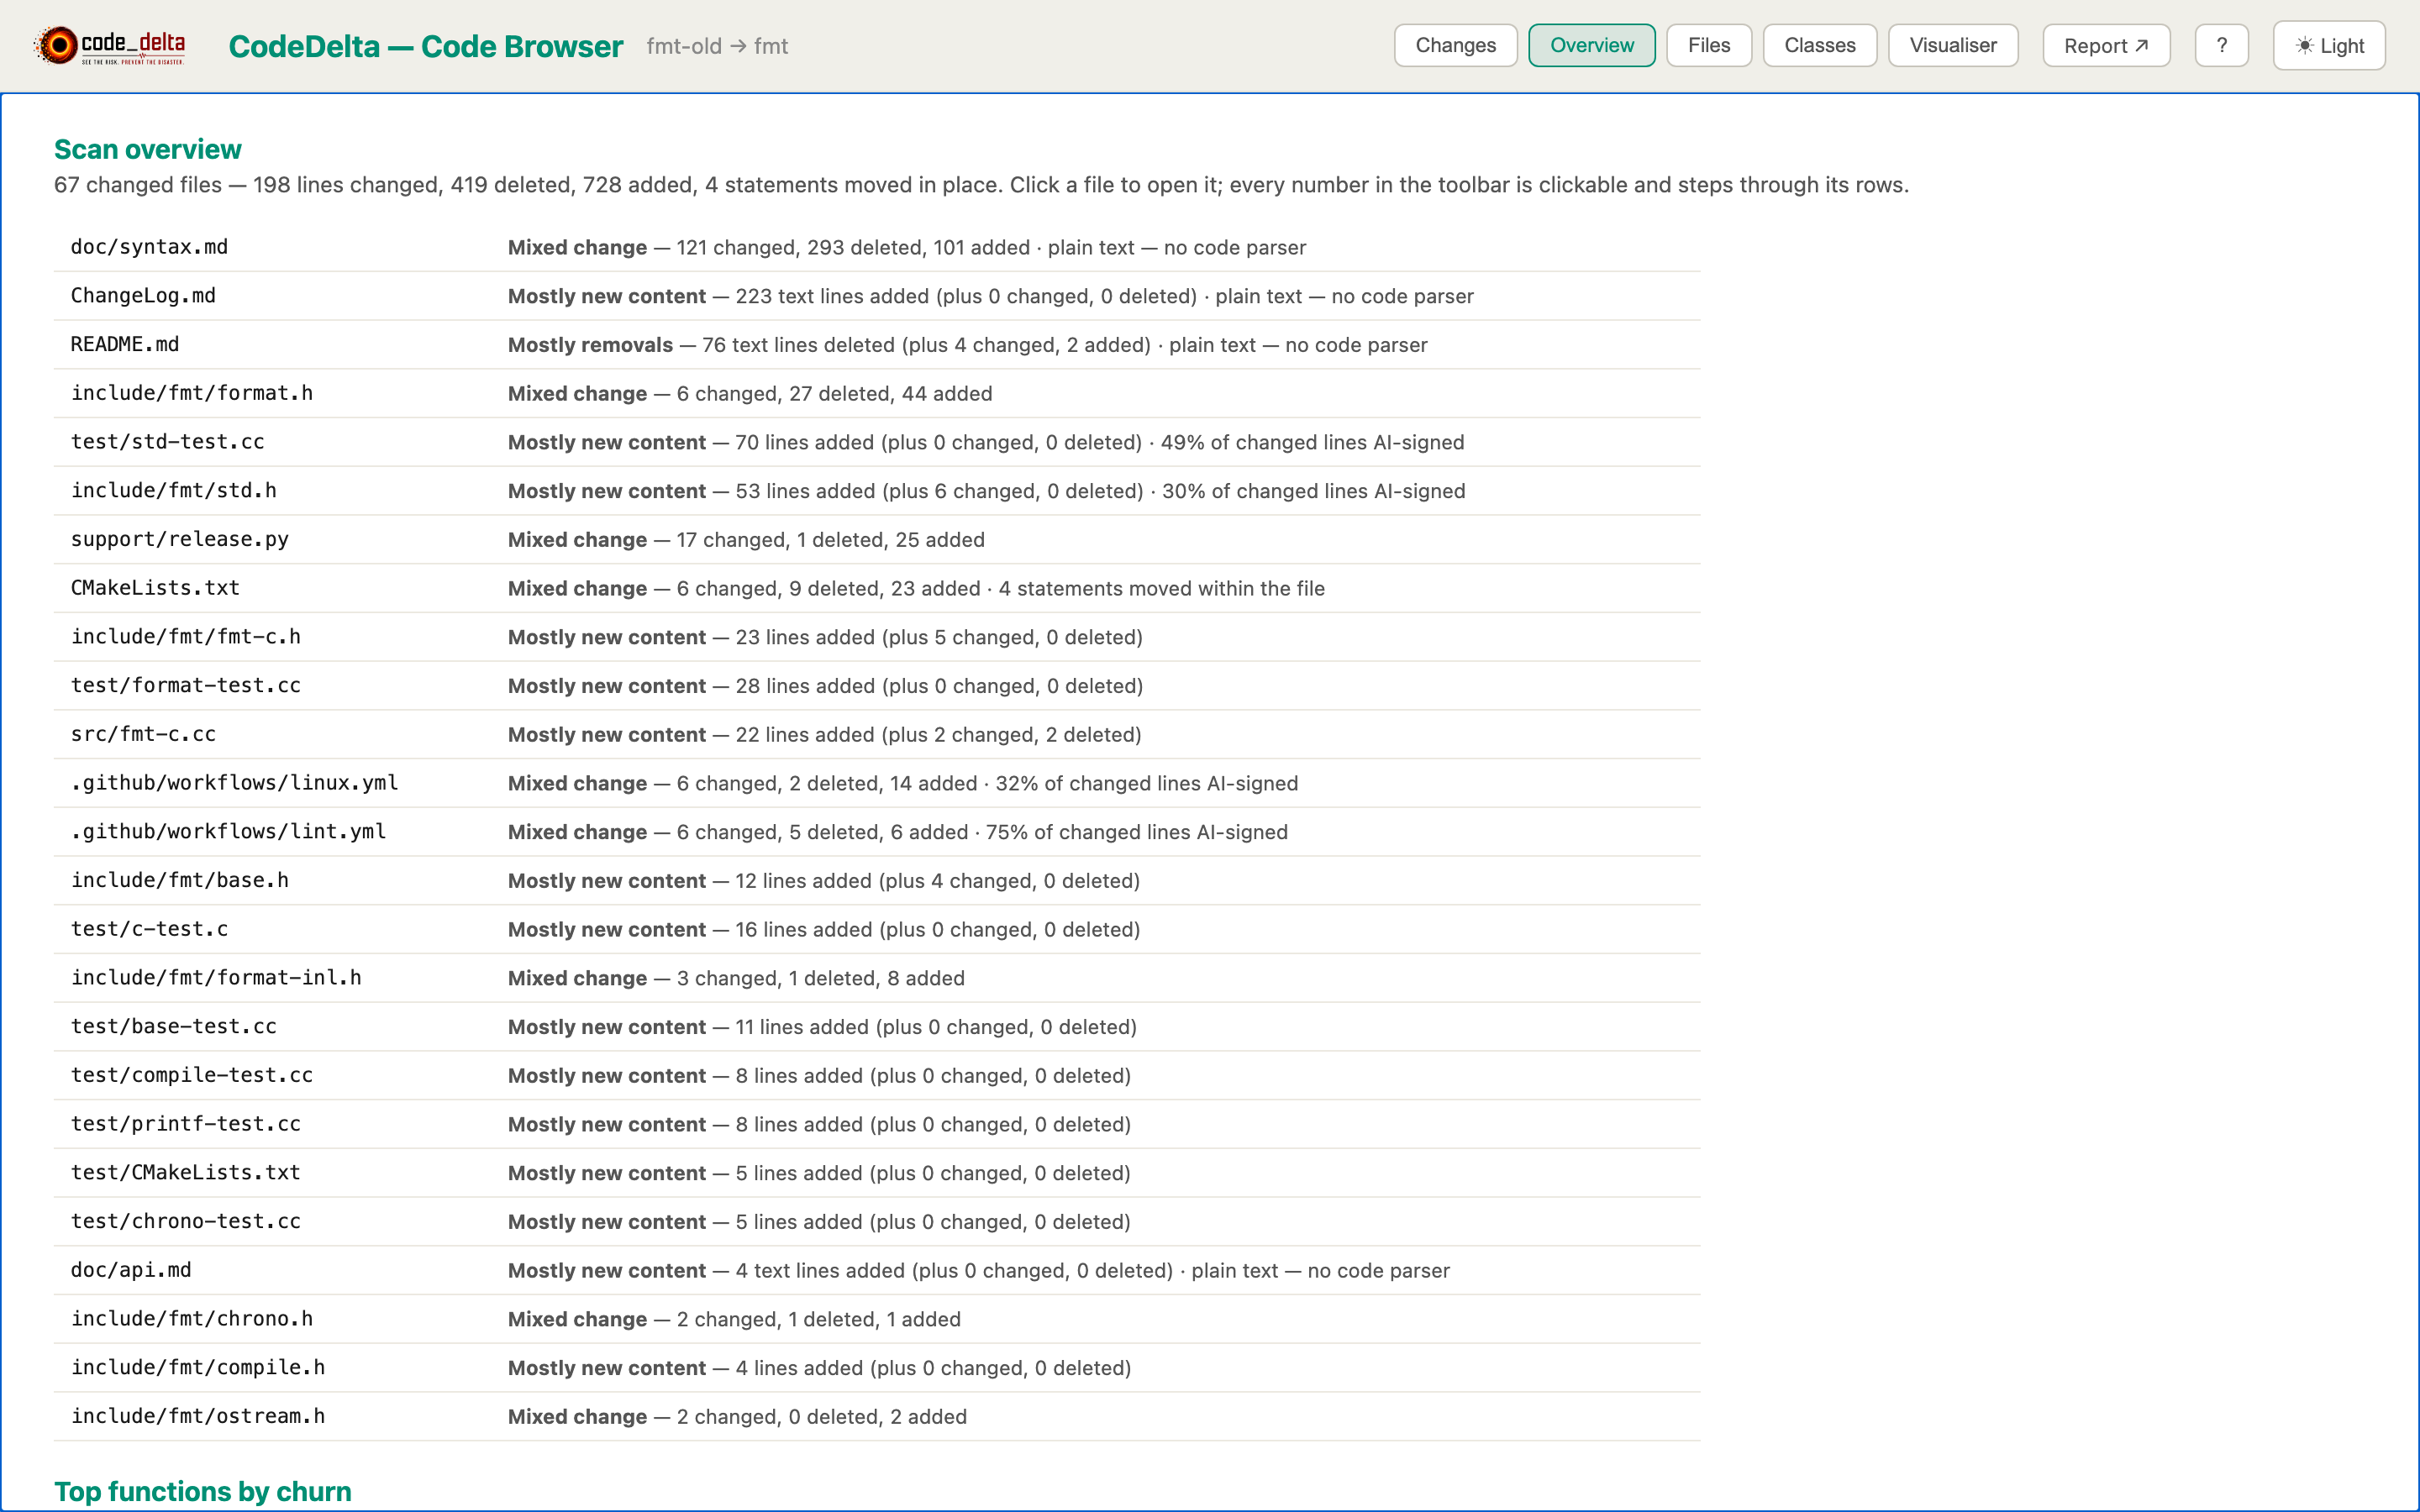
Out come the churn report, the project overview (the PM-friendly page) and
the Code Browser — plus CSV, JSON and XML unless you ask for fewer
(--html --csv --json --xml pick formats;
none given means all).
The six modes
The same choices the GUI offers, under one flag.
| --mode | What runs |
|---|---|
churn | Churn only — the default when you give two versions. |
churn_agent | Churn + Agent Scan, no ML — the GitHub Action’s default. |
agent | Agent Scan only. |
ai | AI code audit only. |
ai_audit | AI audit + Agent Scan on a single project — the default when you give one directory. |
both | Everything: churn + AI audit + Agent Scan. |
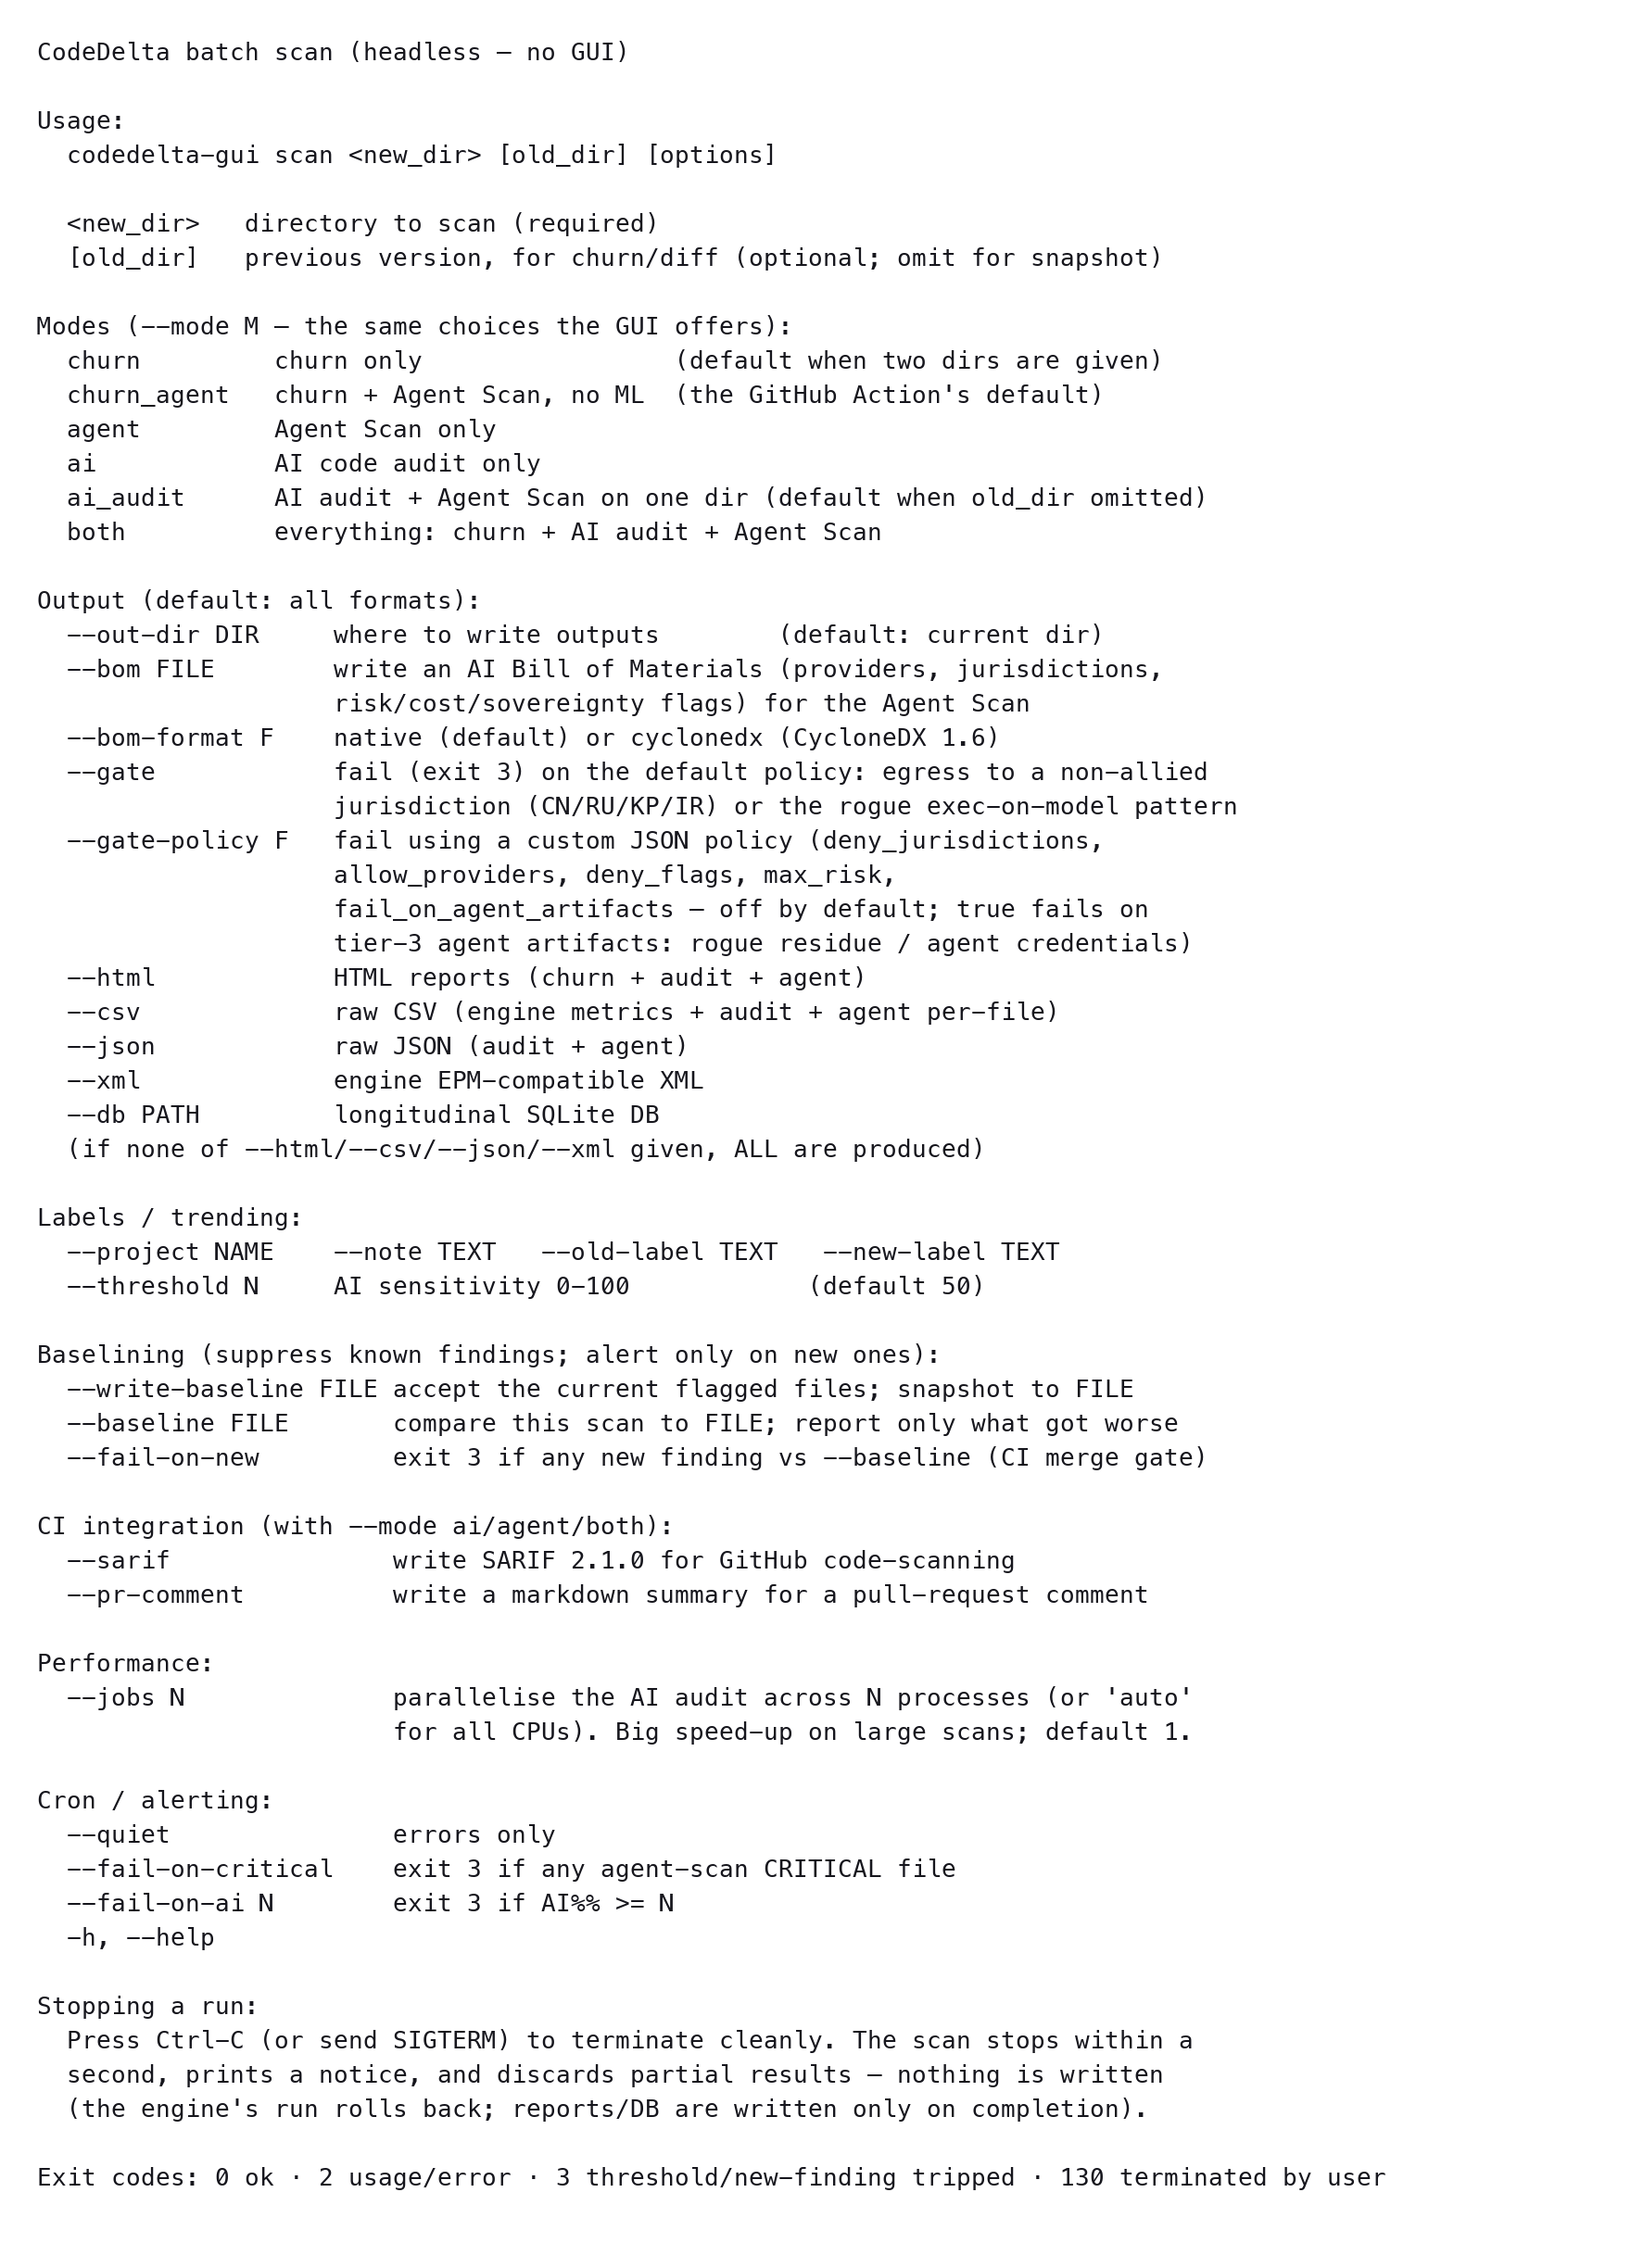
scan --help, verbatim — every mode, output, gate and exit code on this page comes from here.The weekly loop
The longest-standing deployment pattern for this engine — running for years inside an enterprise quality system: a scheduled scan, a growing database, and the outputs feeding the customer’s own tooling.
Add --fail-on-critical, --fail-on-ai N or
--gate and the exit code (3) becomes your alert; add
--baseline/--fail-on-new and only regressions fire it.
The trend database
Pass --db and every scan appends to one ordinary SQLite file.
Four tables do the work: project → run →
file_metrics (every file’s size, comments and churn, per run) and
run_totals (the roll-up). Nothing proprietary — any SQLite client, ORM or
BI tool can read it, which is how the output feeds a quality system you already own.
Or skip the SQL: codedelta-gui trend trend.db --out trend.html
turns the same history into the executive summary — headline numbers, arrows against the
previous run, churn and AI% charted across runs.
Isn’t cloc a churn tool?
No — and the distinction matters. cloc is a line counter, and a fine
one: point it at a directory and it tells you how many lines of code, comments and blanks are
there, per language. It also has a --diff mode that compares two directories and
reports lines added, removed and modified — and because that output looks like
churn, teams quote it as churn. That’s the trap. It’s comparing raw text lines, not
statements: reformat a file and it counts change where nothing changed.
CodeDelta’s second pass parses the code into logical statements — the unit every churn figure uses — so a re-wrapped line isn’t change, but an edited statement is. Data files such as JSON are measured separately and never enter the churn totals. And the TRUE_CHURN measurement goes further still: machine-generated content — lockfiles, generated bindings — is identified by rule and set aside, with each excluded file named, so the subtraction is checkable. On one npm/cli release, 80.1% of the apparent churn came from a single generated file. What remains is the churn a person actually wrote.
We ran both tools over six and a half years of Erlang/OTP on identical commit hashes. cloc’s diff aborted on three of seven windows and silently skipped 4,046 files, with no coverage line to say so. CodeDelta’s churn measurement — logical statements changed, deleted, added and moved — is a different instrument answering a different question, and it accounts for every file in the tree: measured, counted as text, or named as set aside (images, compiled binaries). Nothing is silently dropped. The full side-by-side, with per-window output: cloc vs CodeDelta and the Erlang/OTP measurement.
What comes out
HTML reports
The churn report, the project overview and the Code Browser — self-contained files you can archive or serve.
CSV
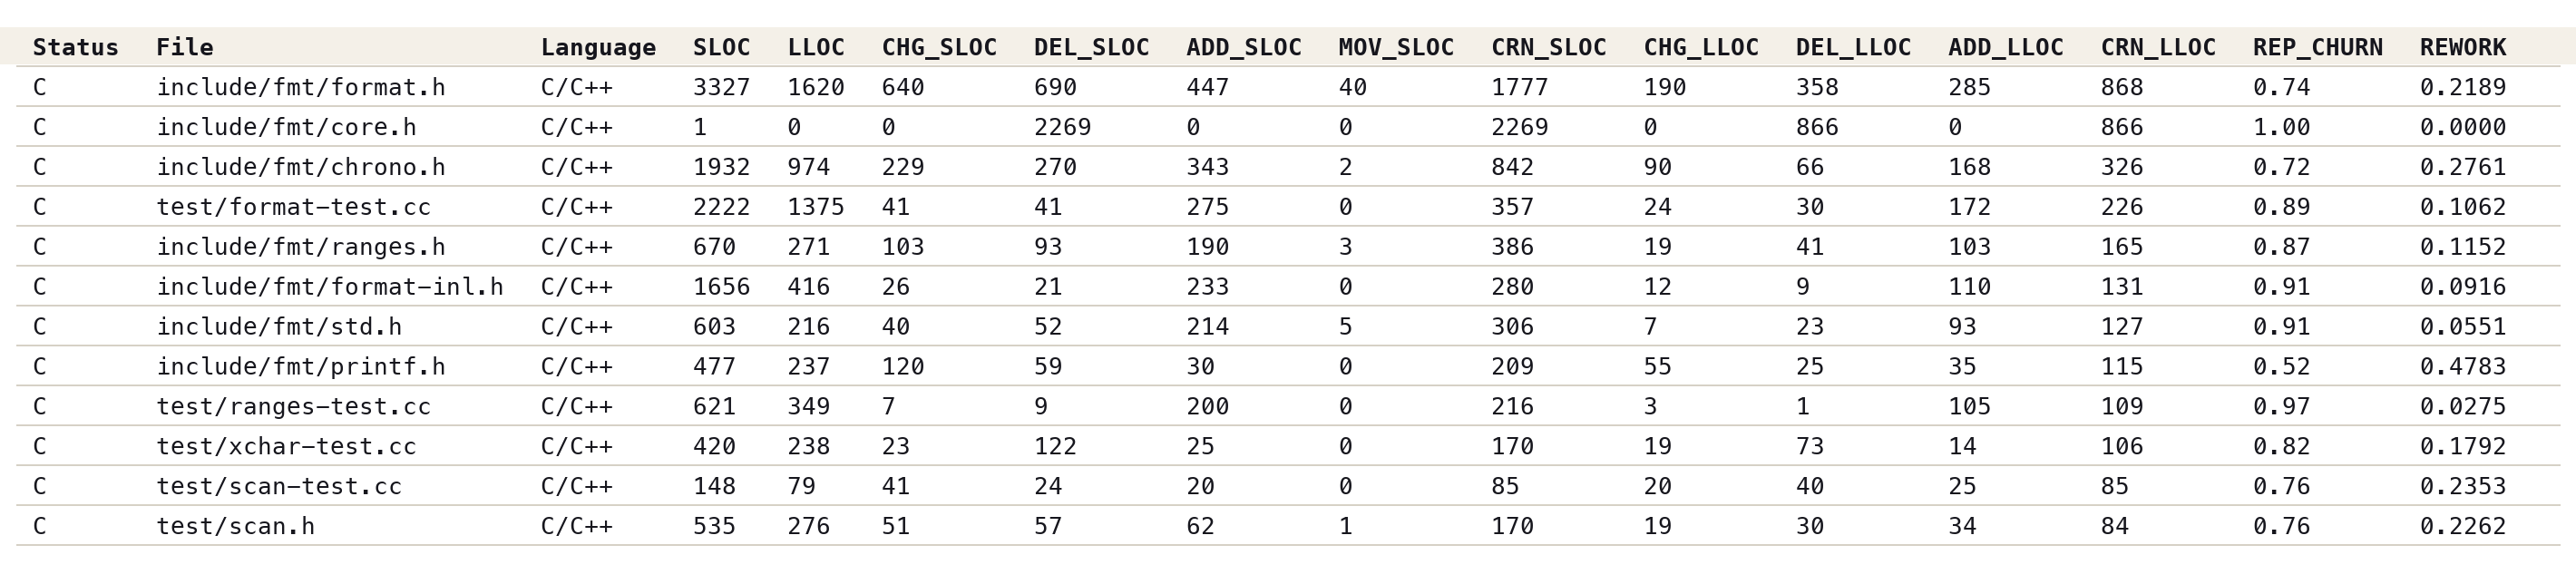
Every metric per file — the integration point for spreadsheets, dashboards and your own quality system.
JSON & XML
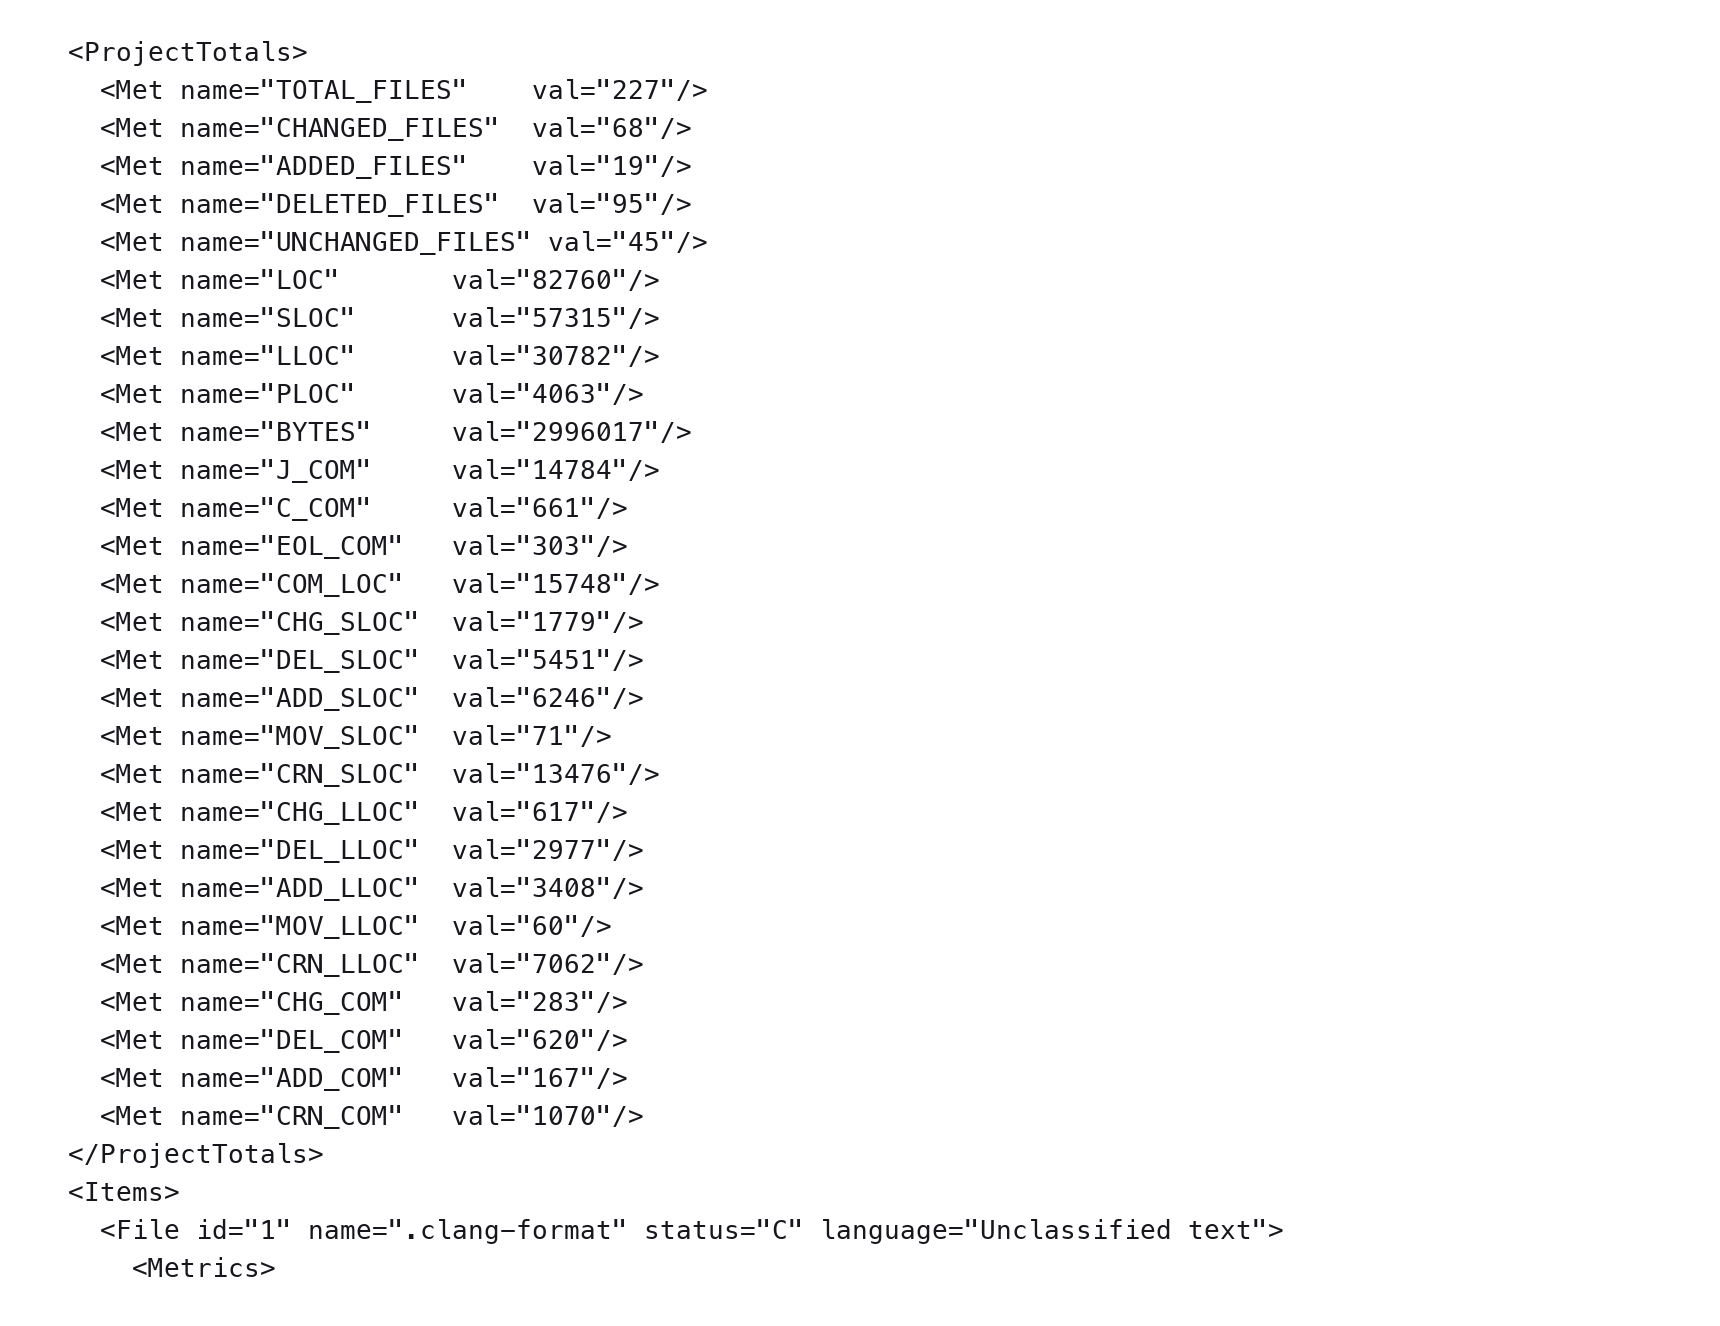
Raw audit and agent findings as JSON; engine metrics as EPM-compatible XML for systems that already read it.
SQLite database
--db appends every run; the trend command turns the history into an executive summary with charts.
AI Bill of Materials
--bom writes the AI-BOM (native or CycloneDX) — which providers your code calls and where the data would go.
Exit codes
0 clean · 3 gate or threshold breached — the one-line contract that lets any scheduler or CI treat a scan as pass/fail.
CODEDELTA_LICENSE in the
environment or put codedelta.lic next to the binary. The public evaluation
licence from the download page works at the command line too.Get the engine
The command line ships in every bundle — macOS, Linux and Windows, free to evaluate. Running it in GitHub, Docker, Jenkins or another CI instead? That’s the CLI / CI page.