CodeDelta +
everything besides churn

True Churn is the headline. This page is the rest of the box — the Code Browser, the AI Agent Scan, the AI Code Scan, the GitHub Action and the desktop app — shown as the screens they actually are. Fifteen screens, one per feature — click any picture to enlarge it.

↓ fifteen screens below
New in v1.9.5

The Code Browser.

Every scan writes one self-contained page that reads the code: five tabs that never leave the screen — Changes (the side-by-side diff, for comparisons), Overview, Files, Classes and Visualiser — with the browser’s Back button and a breadcrumb on every screen. A single-project scan gets the same page without the Changes tab.
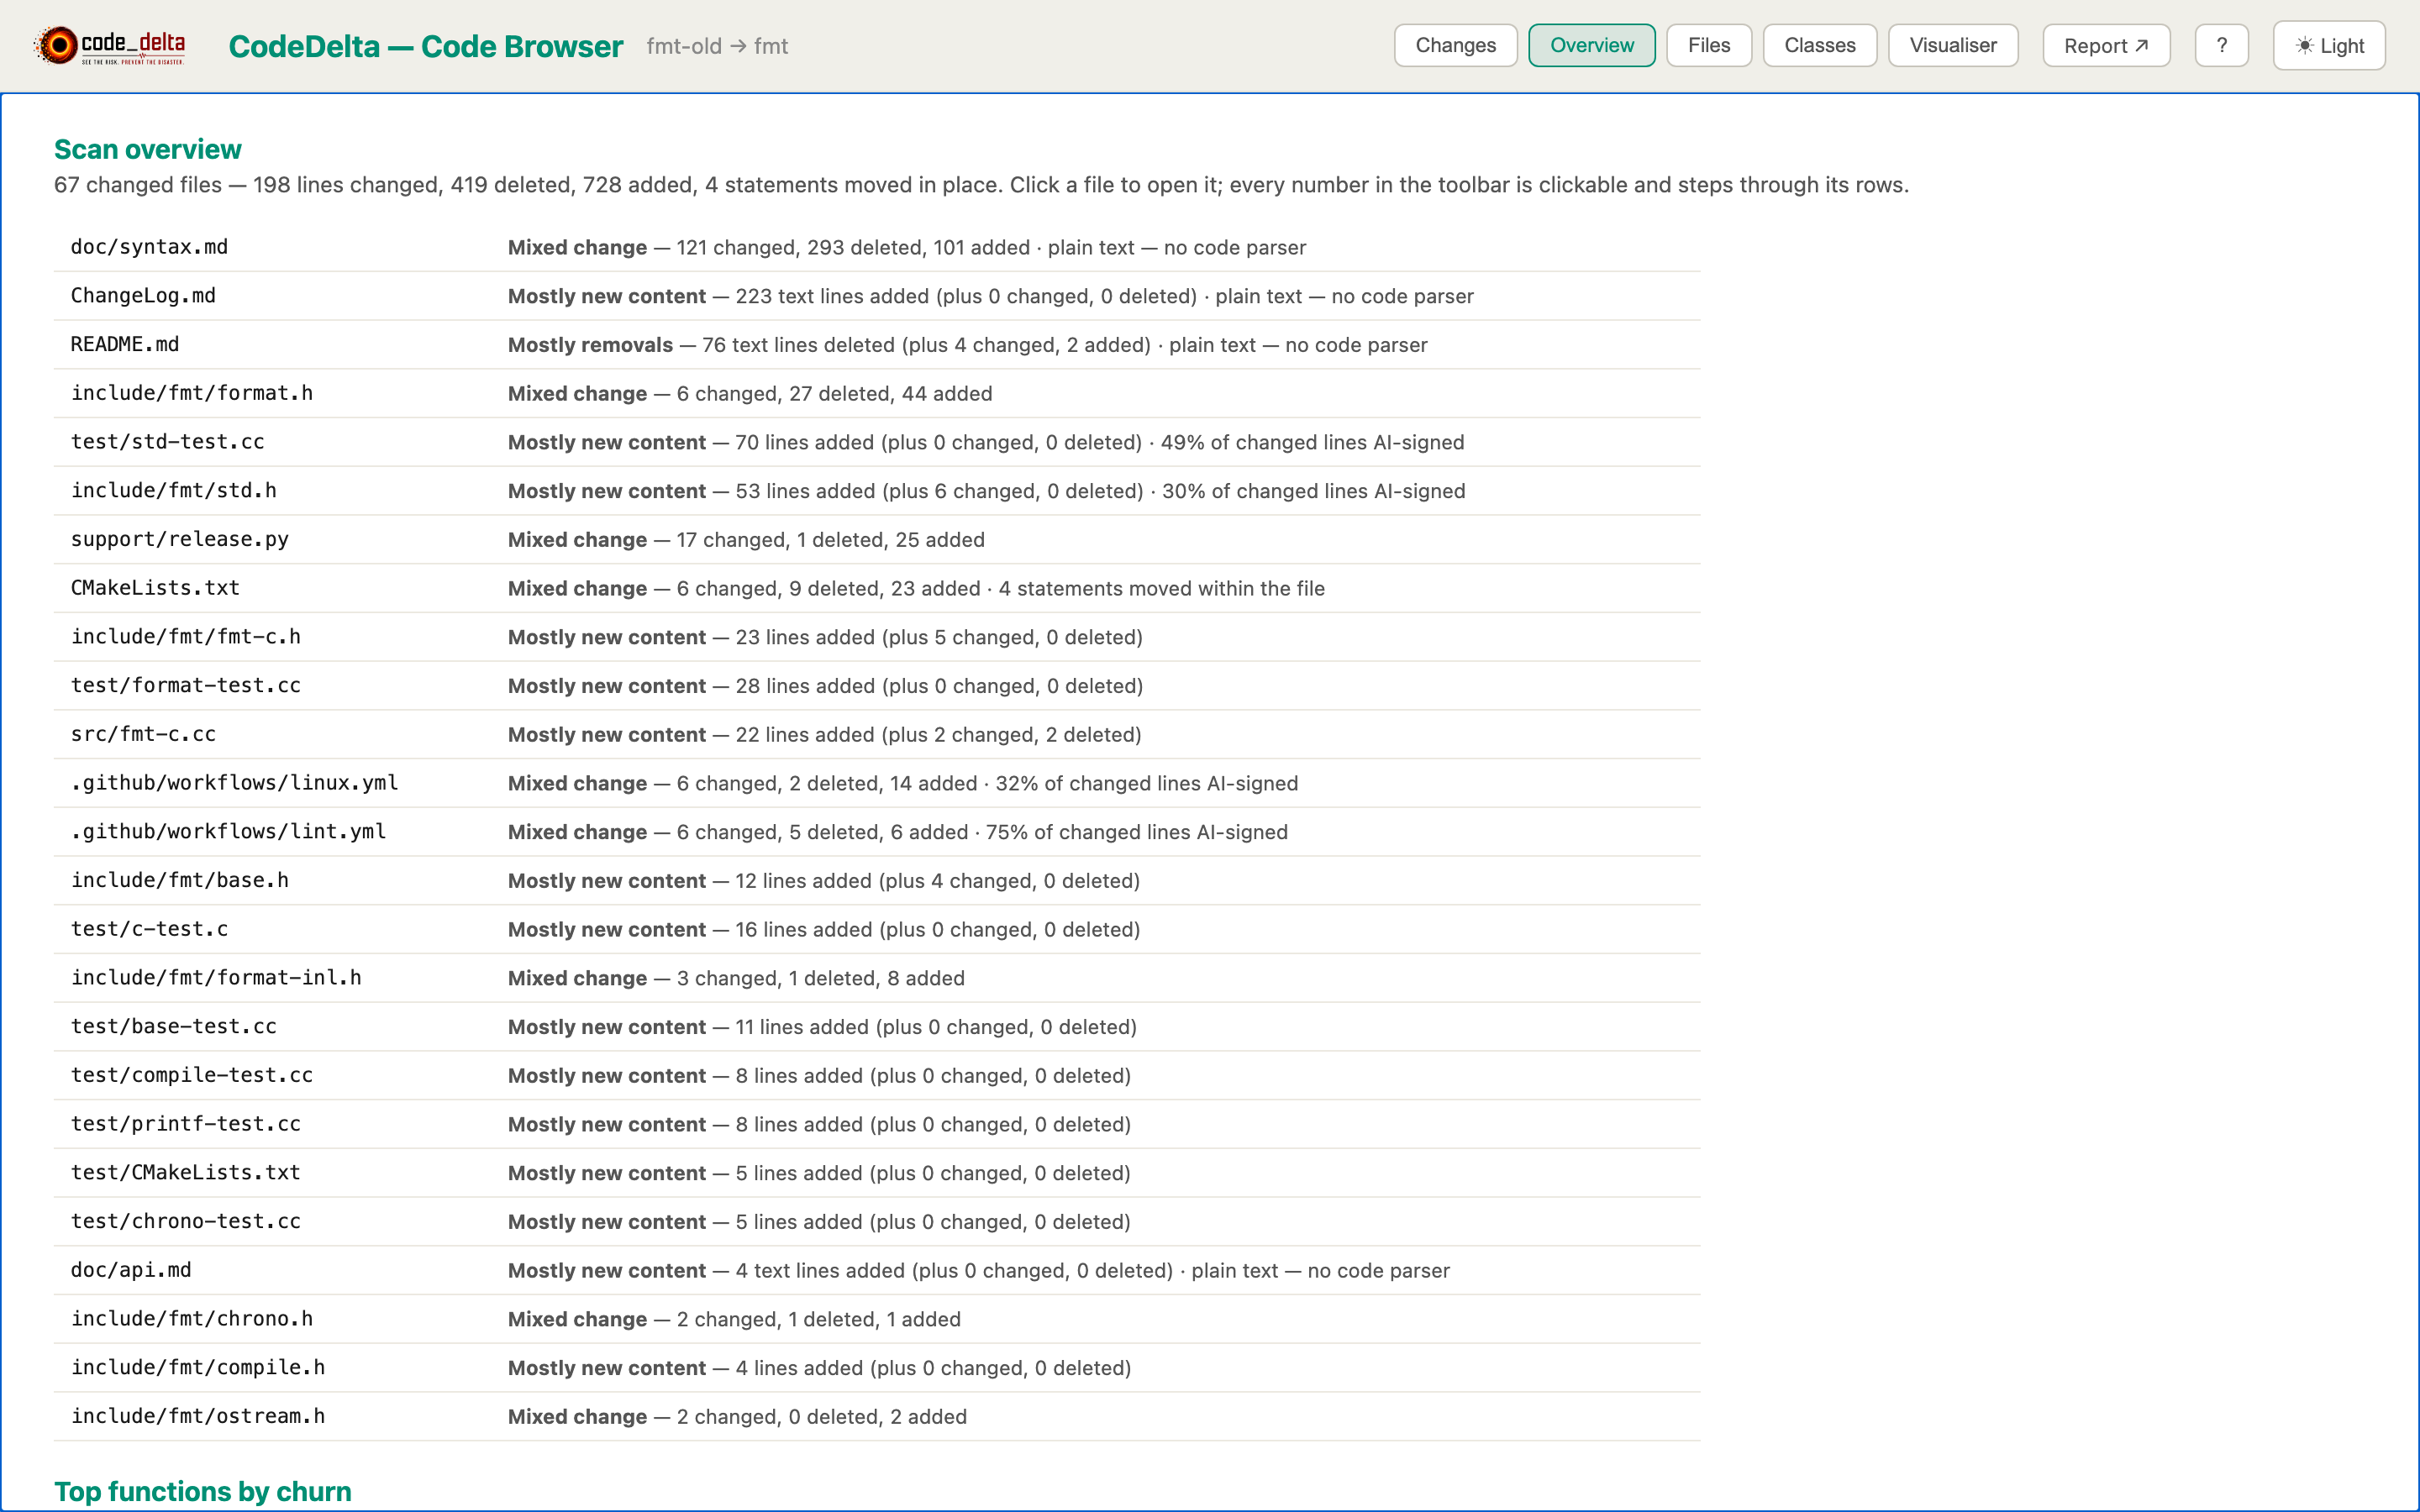
Code Browser — Overview tab on a two-release comparison of fmt: changed files ranked with one-line stories, then the project structure
Overview. A comparison opens with the changed files ranked by what happened in them, each with a one-line story; below that, the whole project — languages, directories with their include links, every class, every file — and changed files open in the diff.
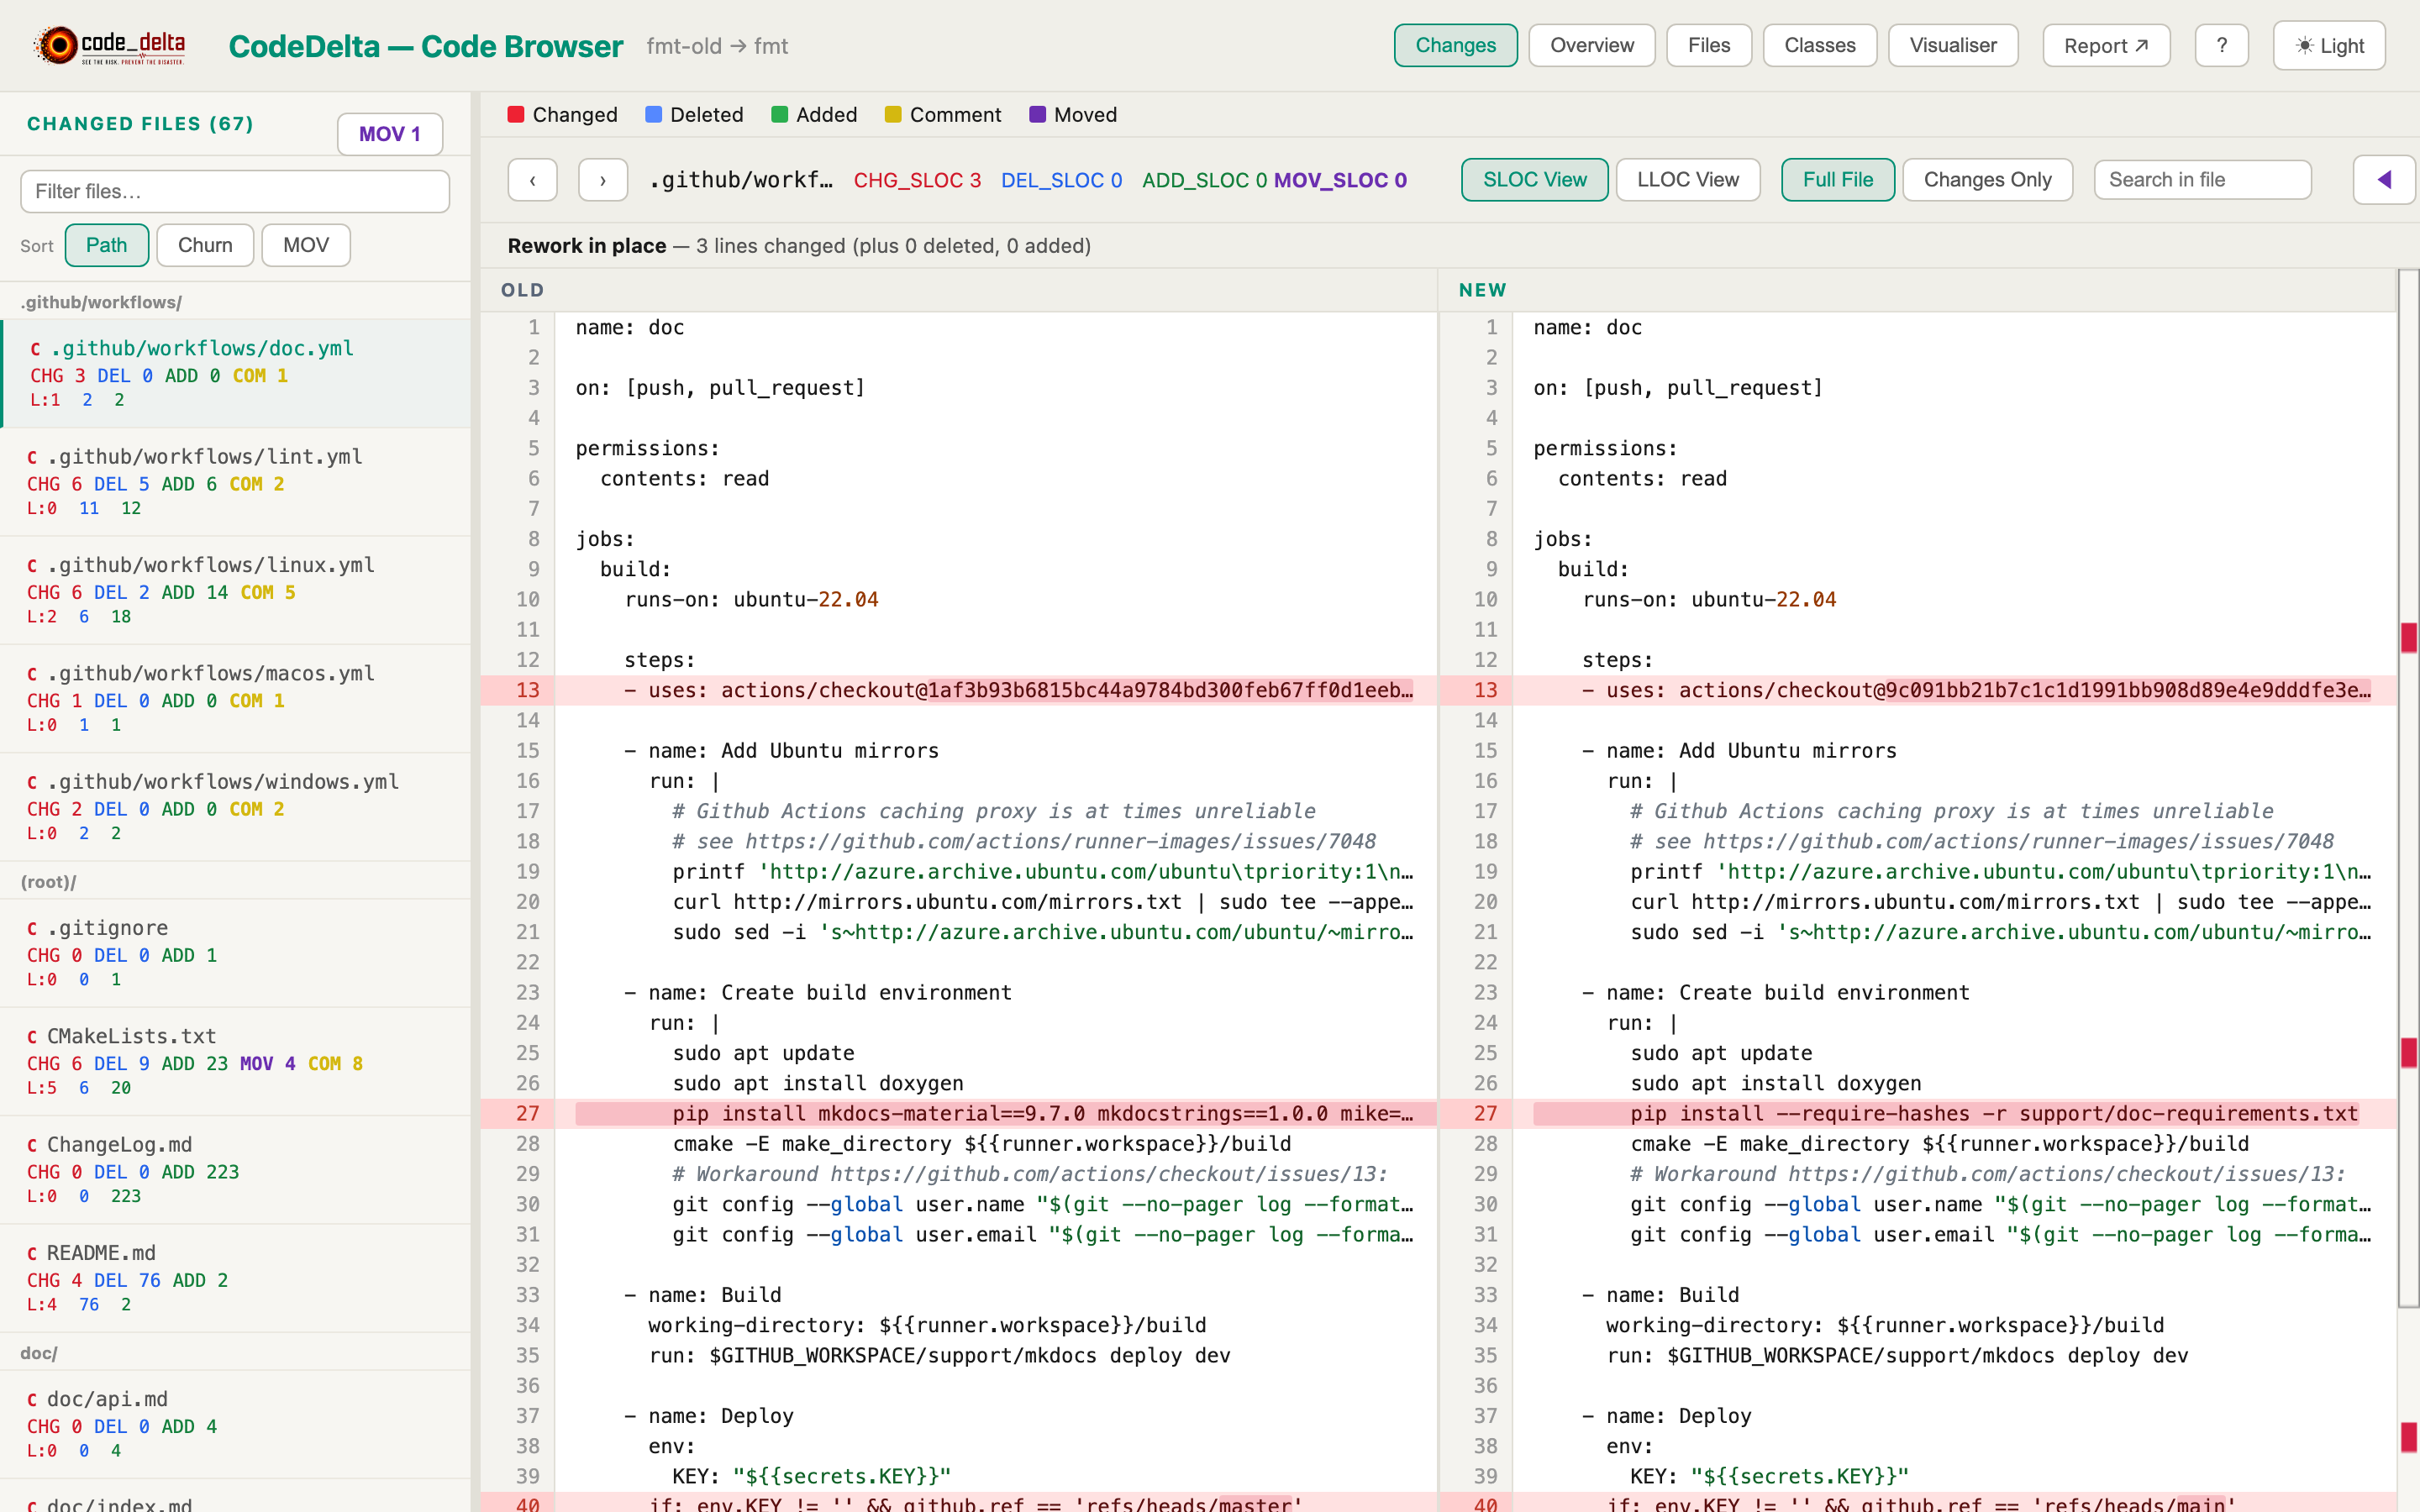
Code Browser — Changes tab: side-by-side diff of a YAML workflow file with changed lines in red, the changed-file list on the left
Changes. The side-by-side diff: every counter in the toolbar is a claim you can click and step through, the Ledger decomposes it into rows, moves paint violet at both ends, and the changed-file list carries per-function churn chips.
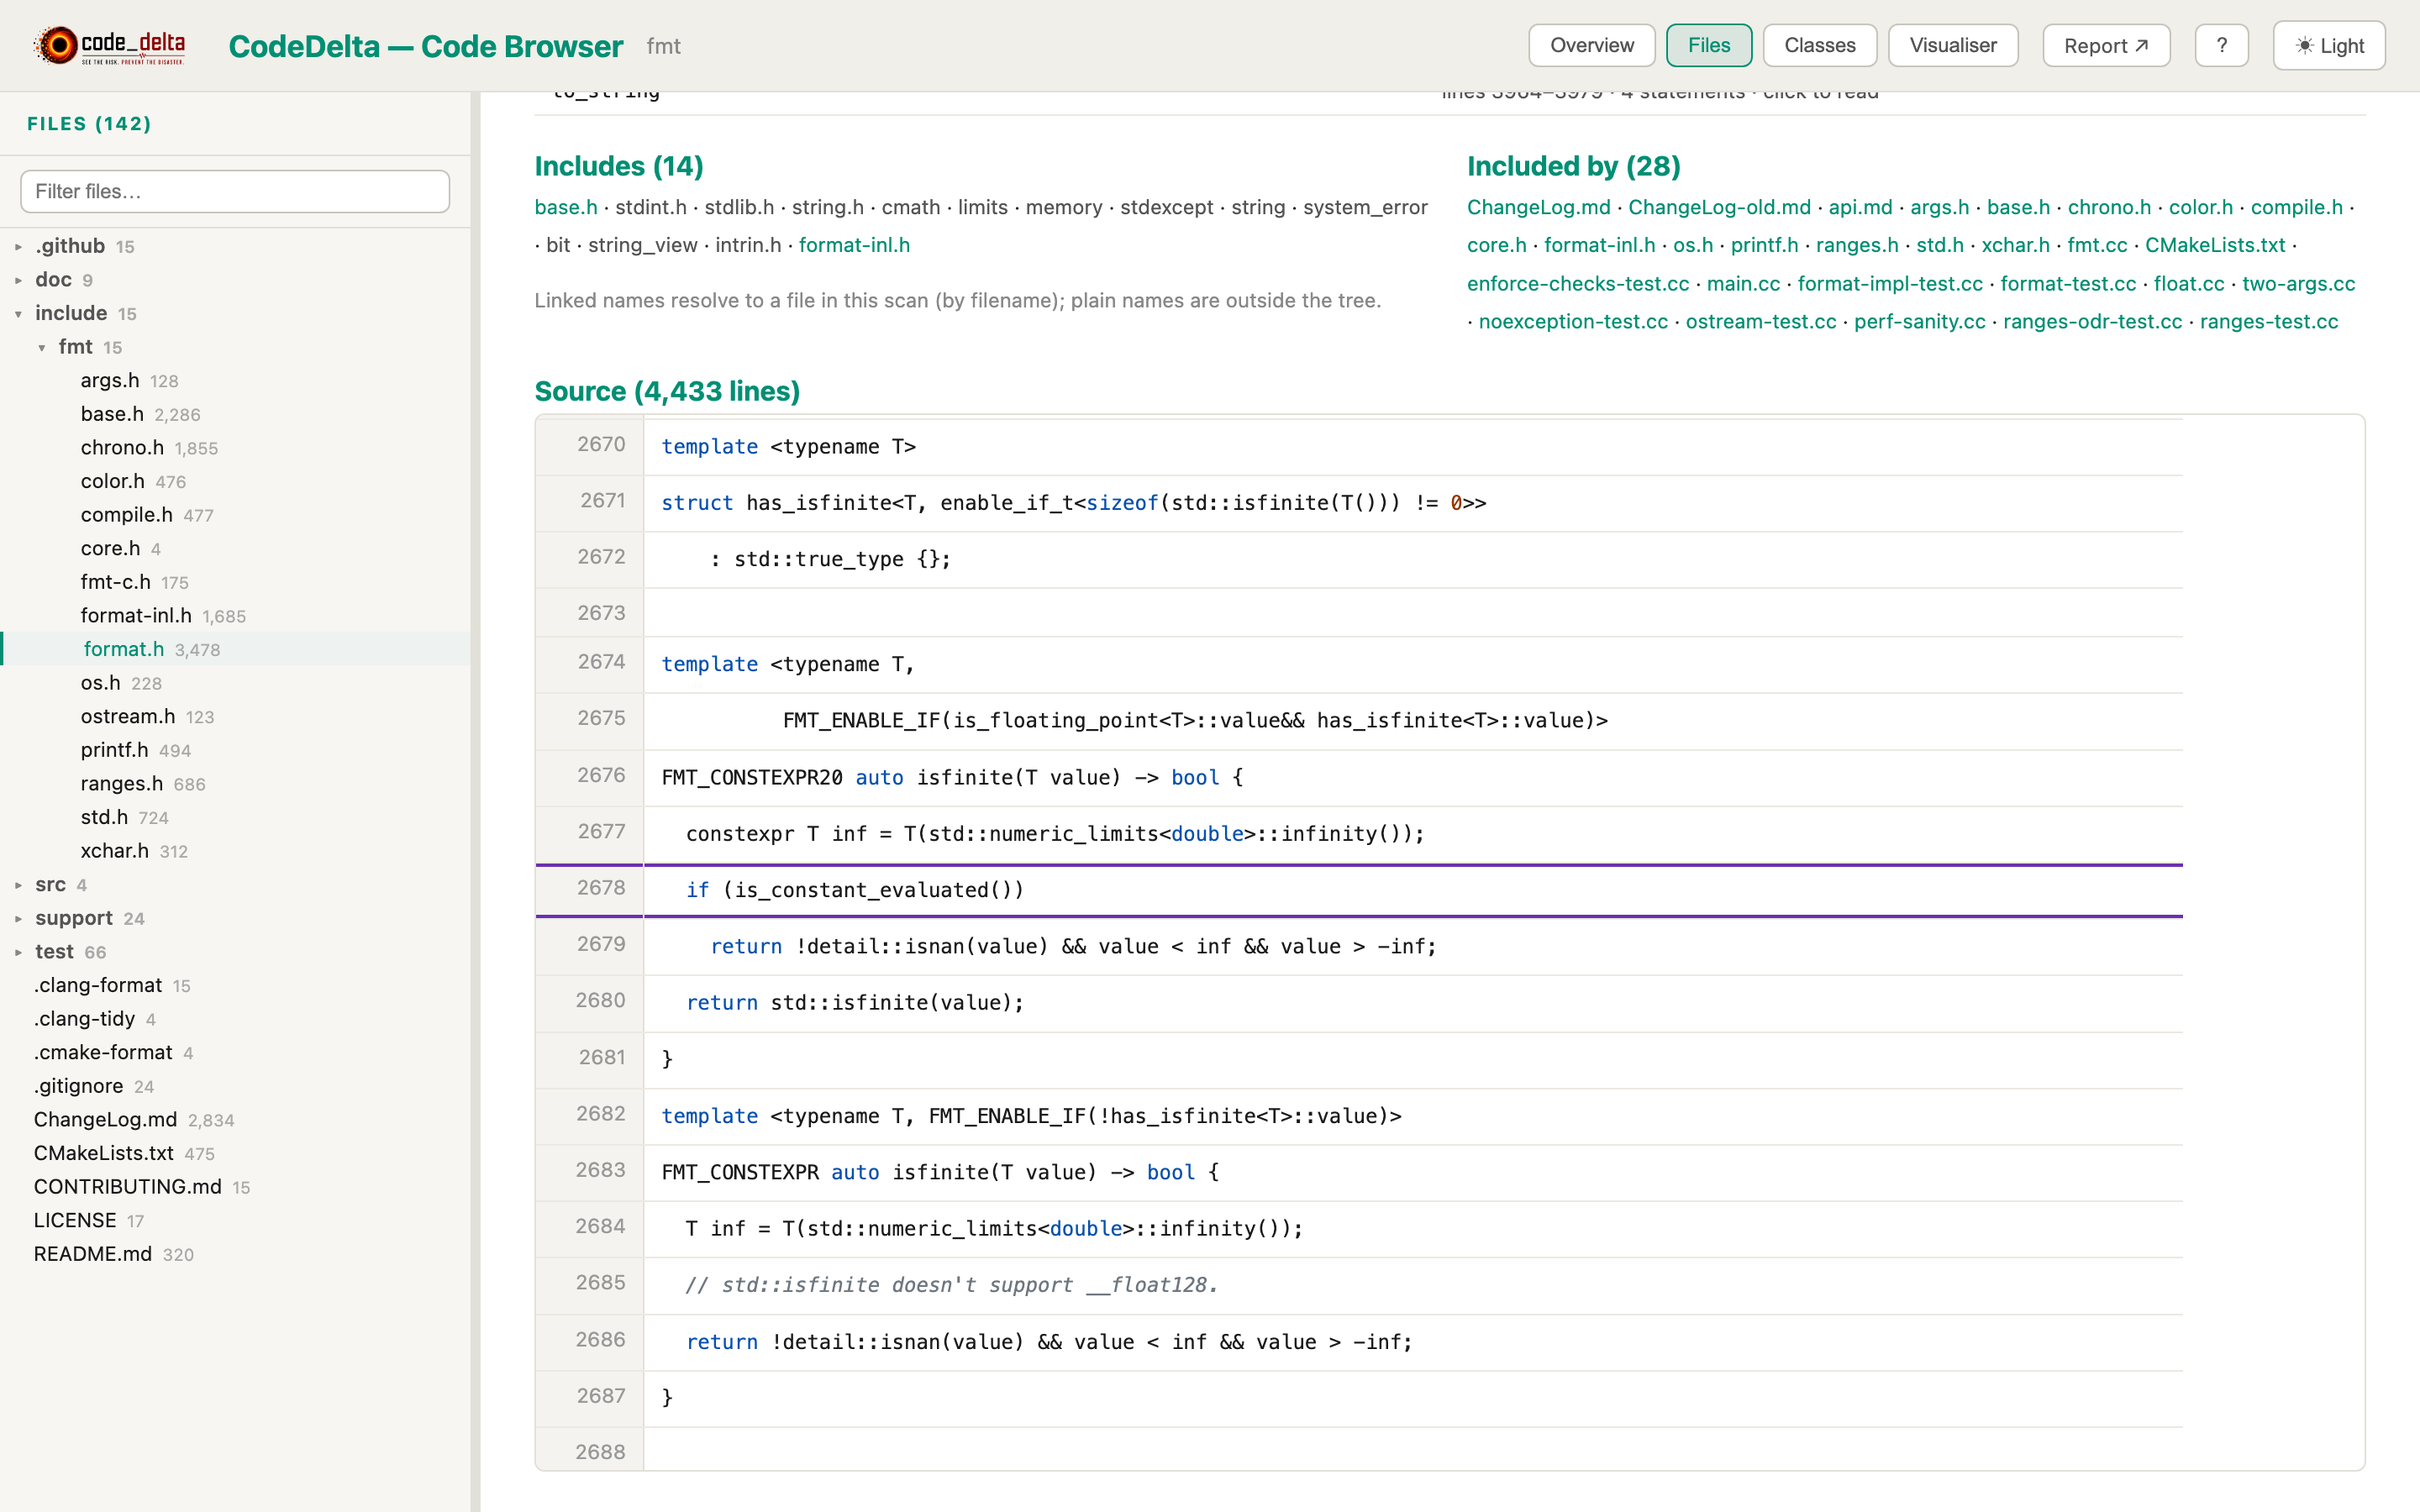
Code Browser — Files tab: directory tree on the left, format.h open in the reader at line 2678 with its includes and included-by lists above the source
Files. A directory tree of every file; the reader shows a file’s classes, its functions in line order, what it includes, who includes it, and the source with line numbers. Changed files wear C/D/A chips and open in the diff.
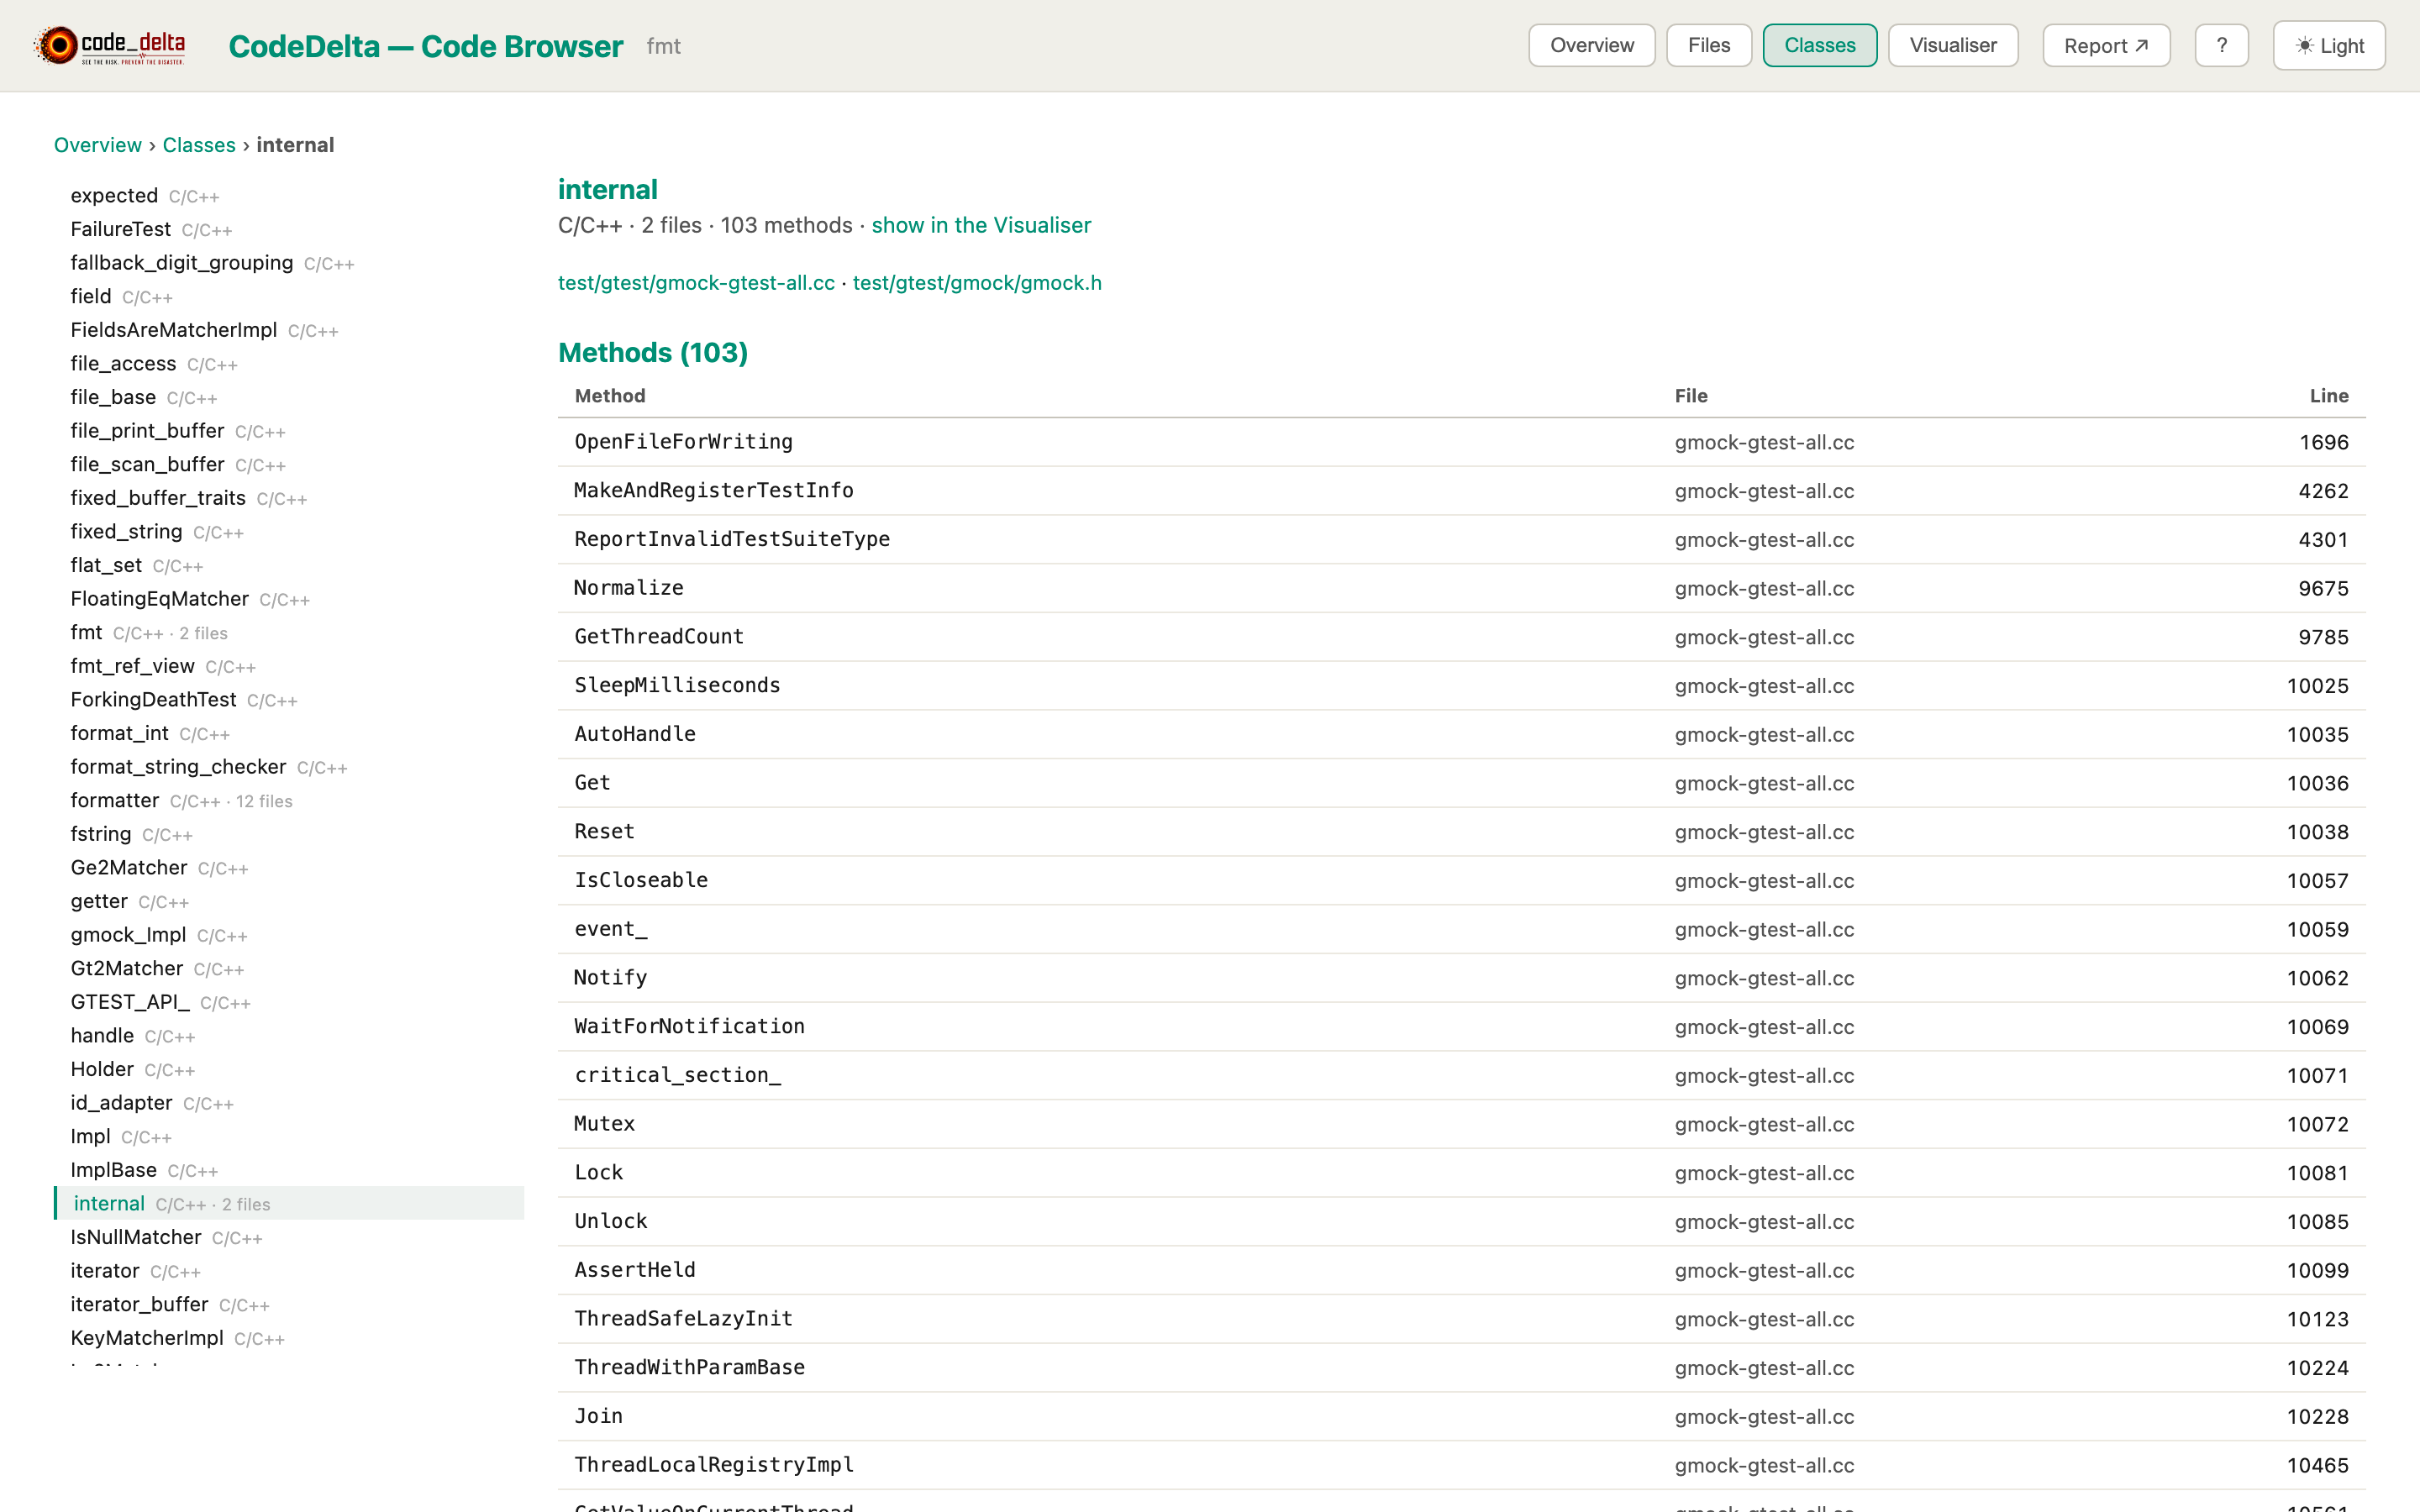
Code Browser — Classes tab: class list on the left, the internal namespace open with 103 methods listed by file and line
Classes. Every class or namespace container found (C++, C# and Java): its files, its methods with file and line, the classes its code mentions — a textual match, each mention cited to file and line — and the classes that mention it.
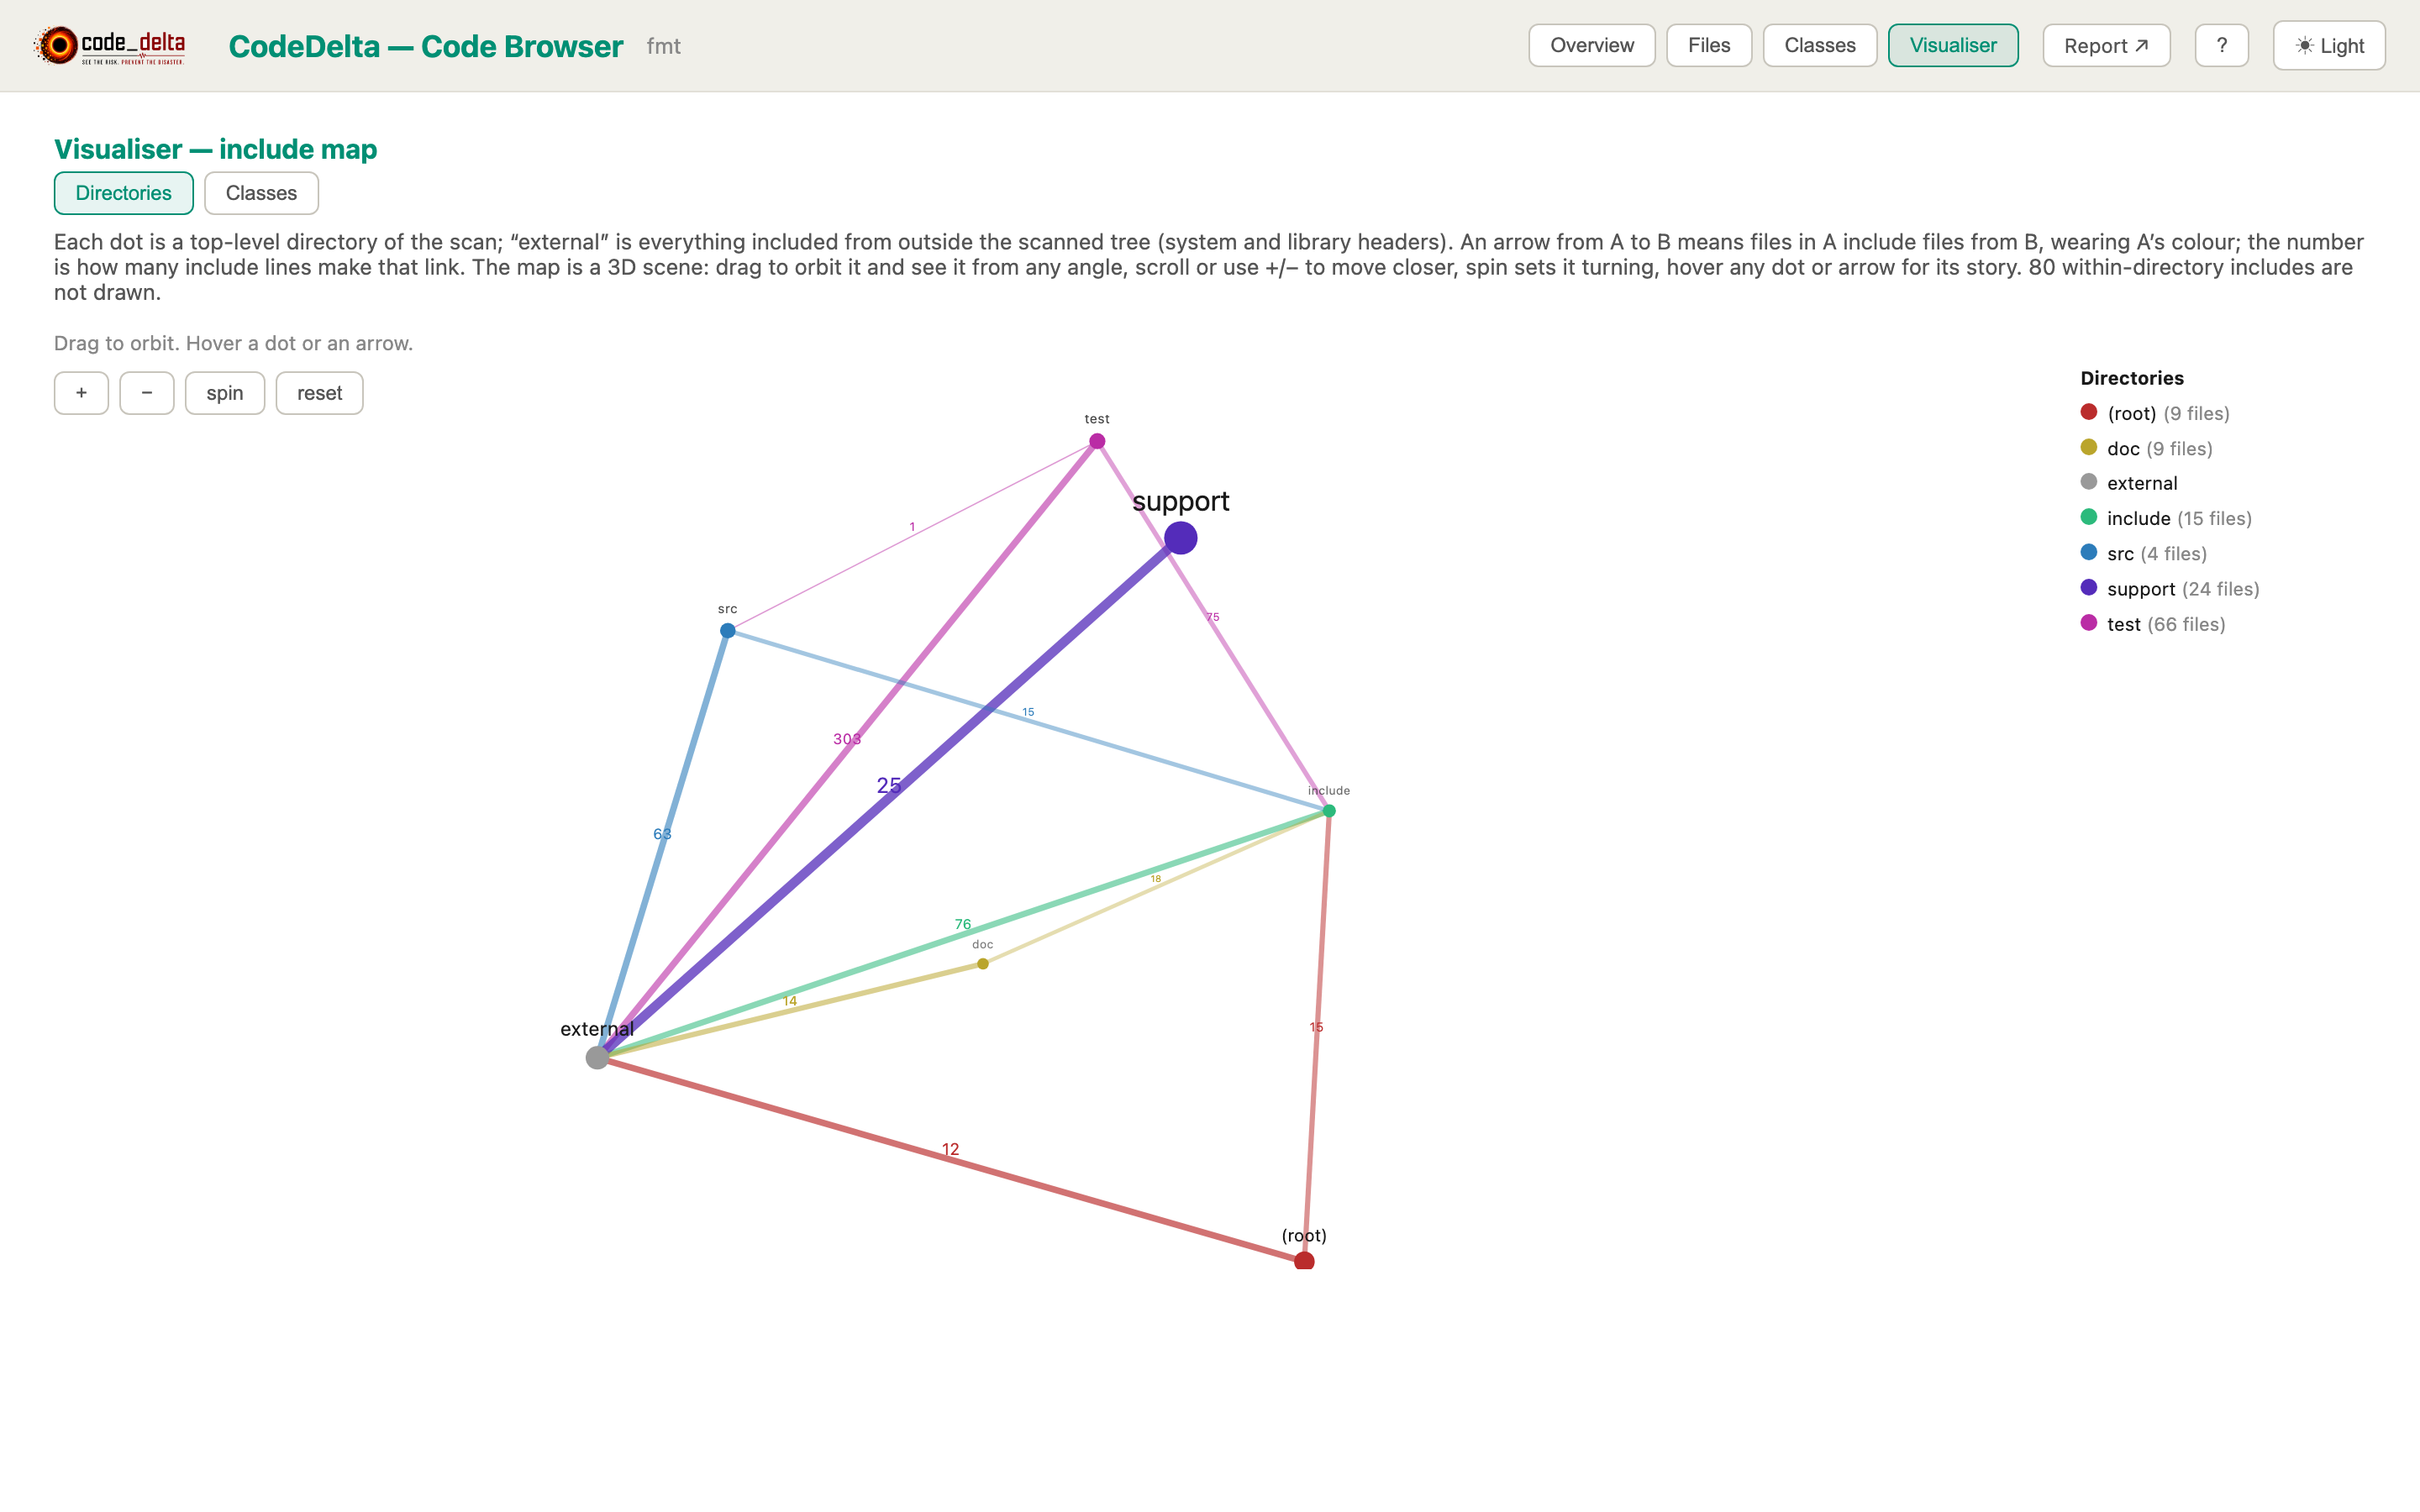
Code Browser — Visualiser, directories mode: the include map drawn as a 3D scene, one dot per top-level directory, arrows with counts
Visualiser — directories. The include map as a 3D scene: one dot per top-level directory, an arrow from A to B for every include that crosses between them, with the count on the arrow. Drag to orbit, scroll to zoom.
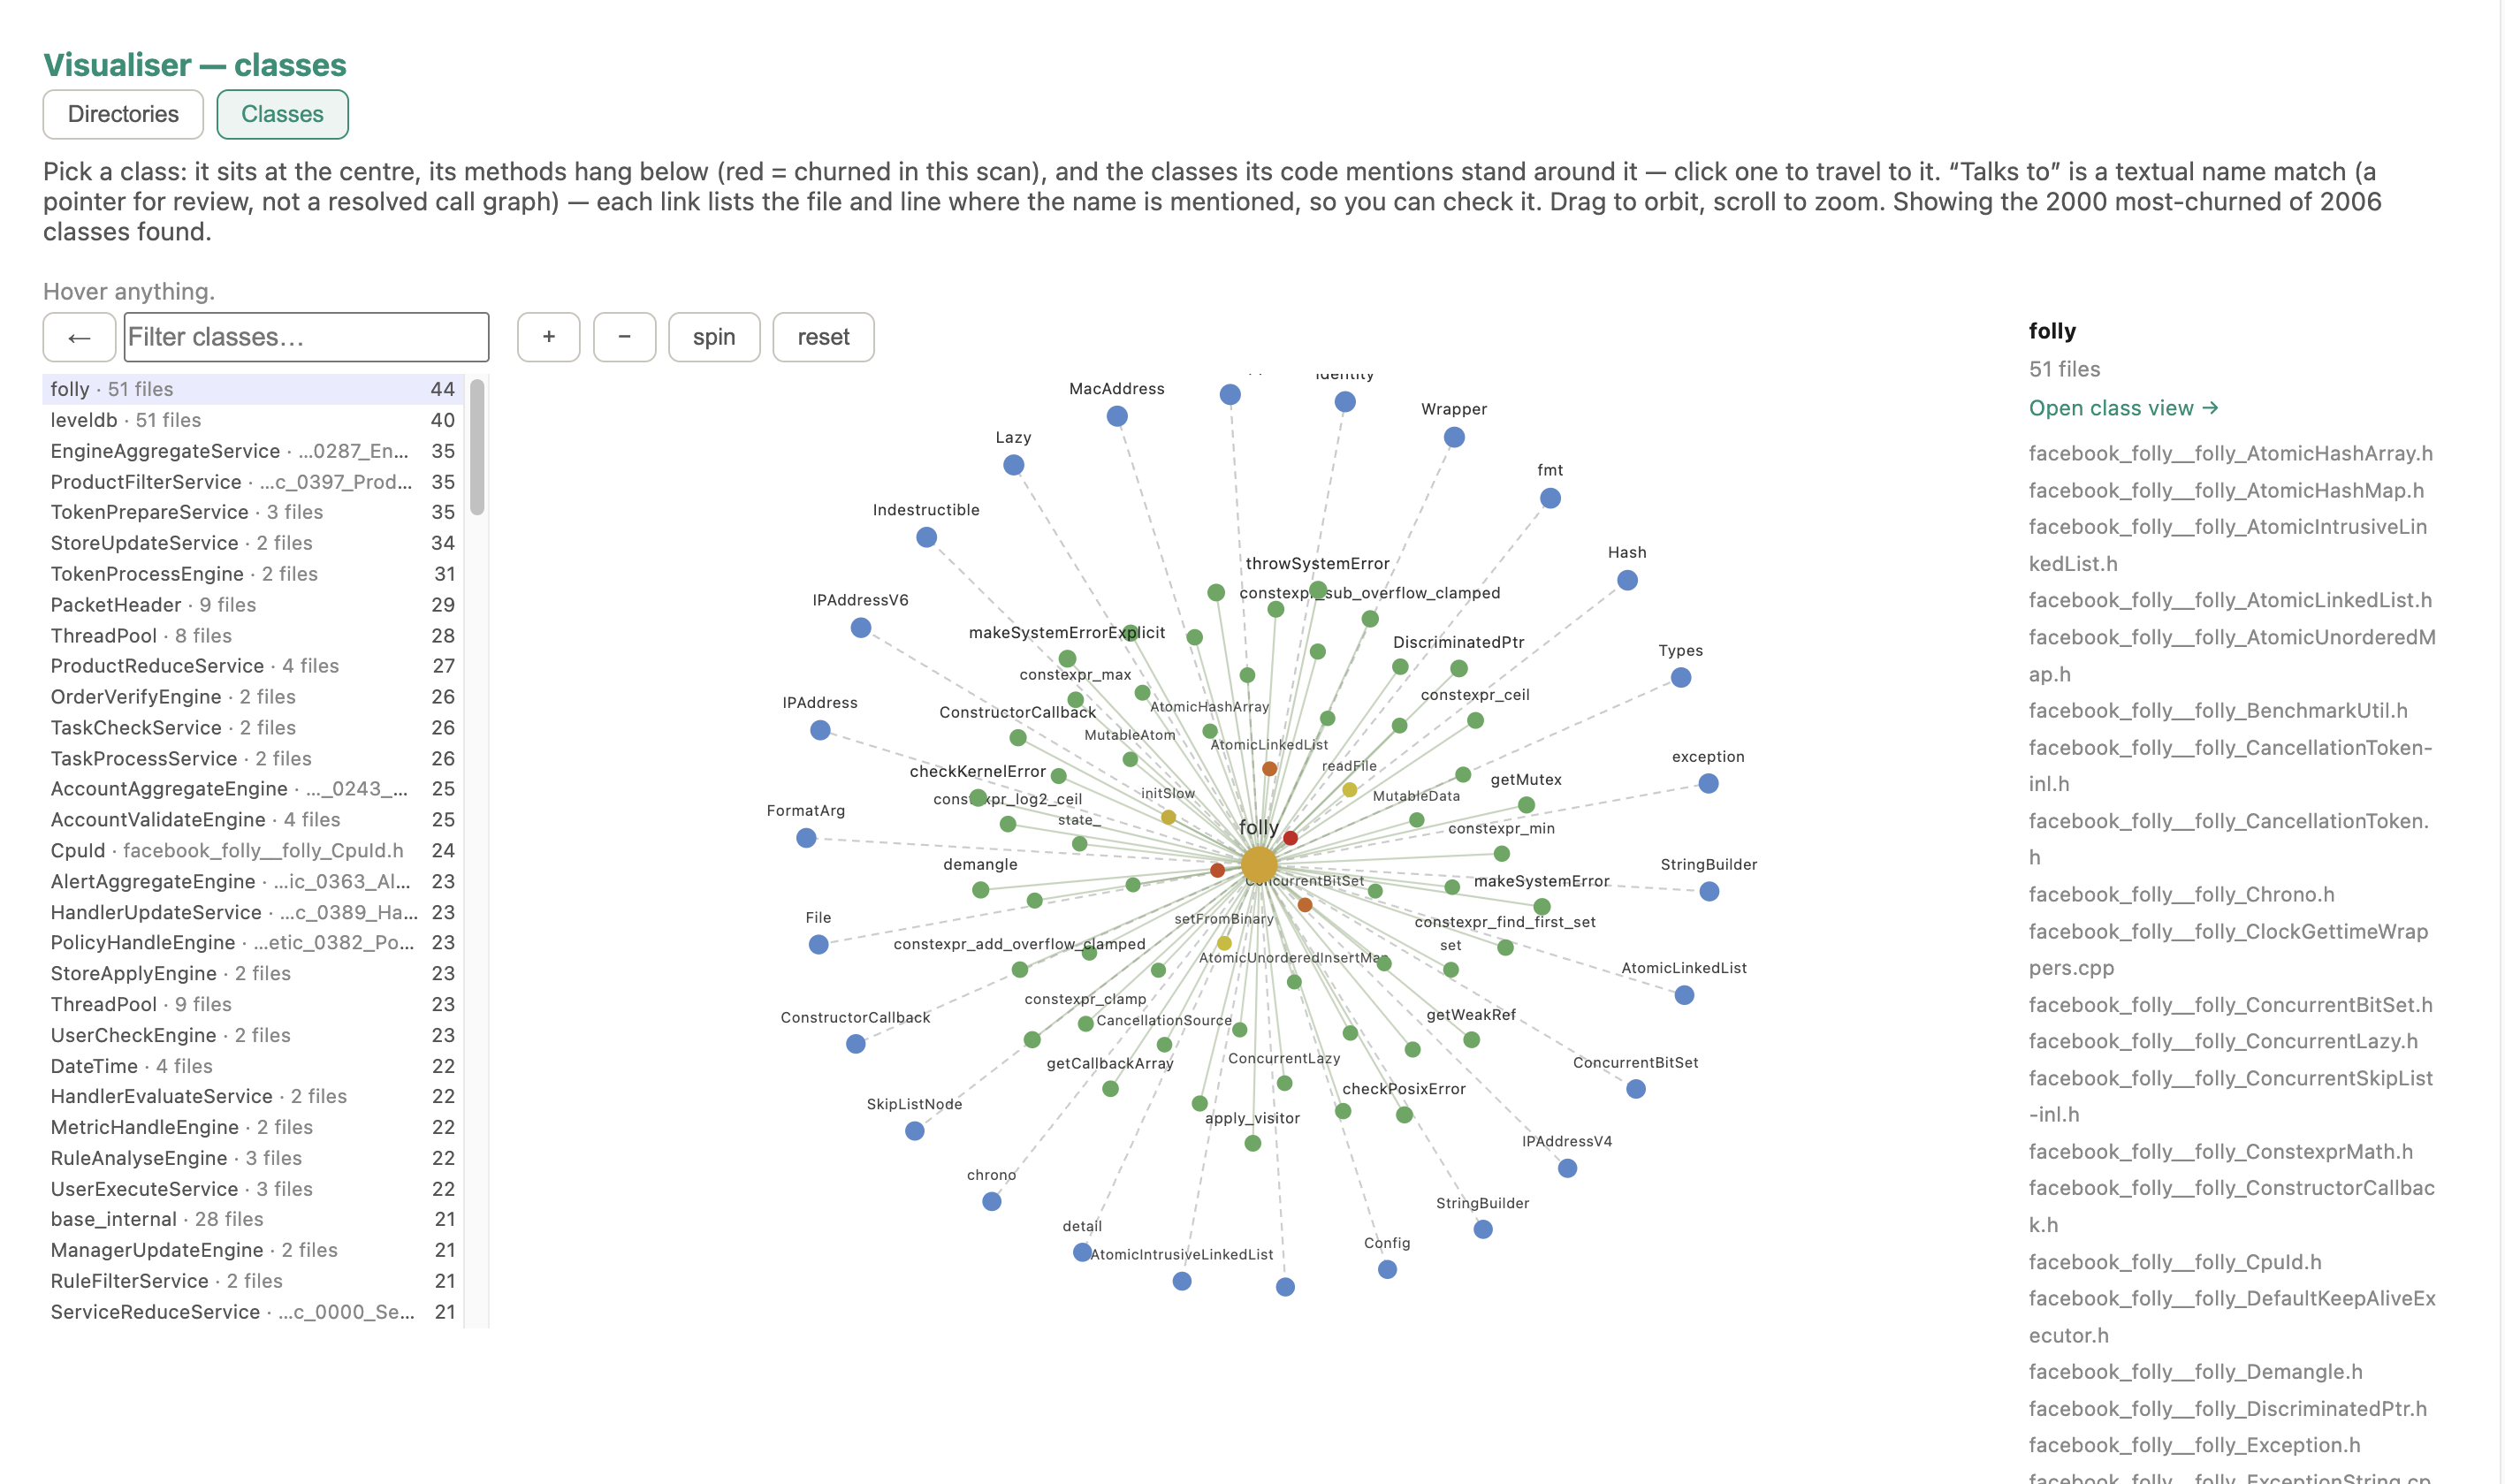
Code Browser — Visualiser, classes mode: the class ego view on a 2,000-class tree with folly at the centre
Visualiser — classes. The class ego view: one class at the centre, its methods round it coloured by this scan’s churn, the classes its code mentions as satellites; click one to travel to it, and every link cites where the mention is.

Read it in the guide: The Code Browser · the papers behind the counters: Papers.
AI agents in your tree

The AI Agent Scan.

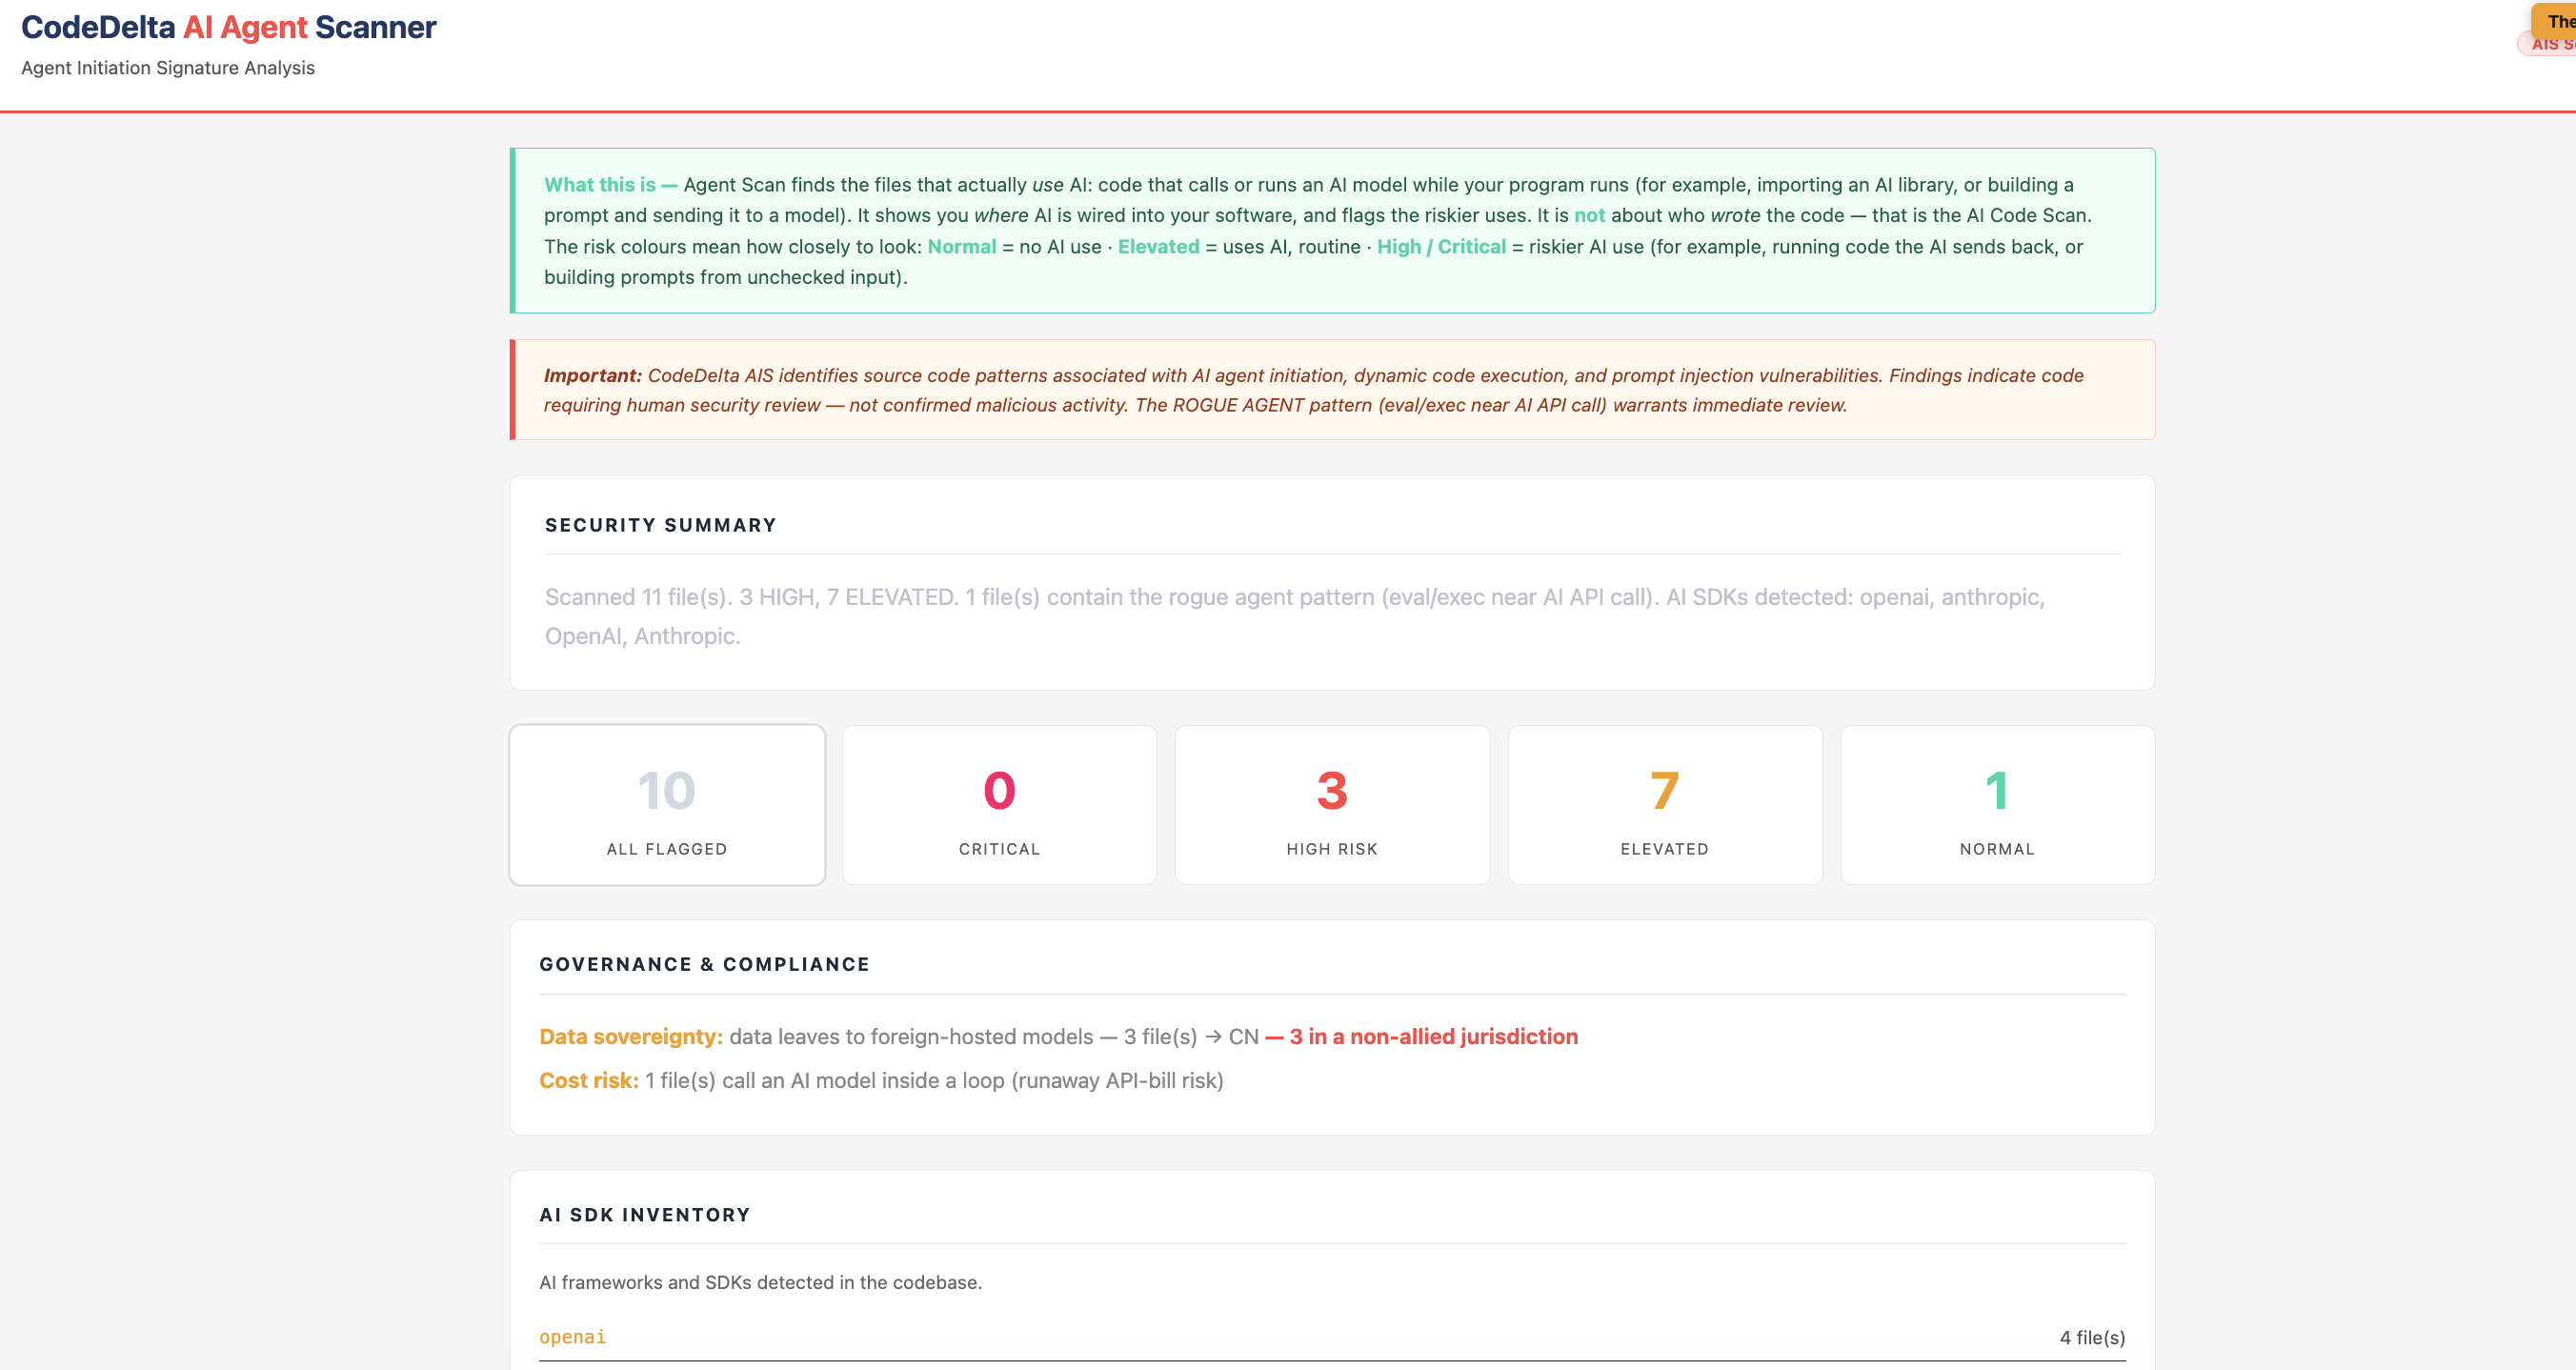
Named SDK calls, model endpoints, exec-on-model-output, raw API keys, non-Western providers — found by reading the code, never by running it. Every flag names the file and line; the Agent Map draws the AI bill of materials as a picture.

CodeDelta AI Agent Scan report — flagged files ranked by risk with the reason for each flag
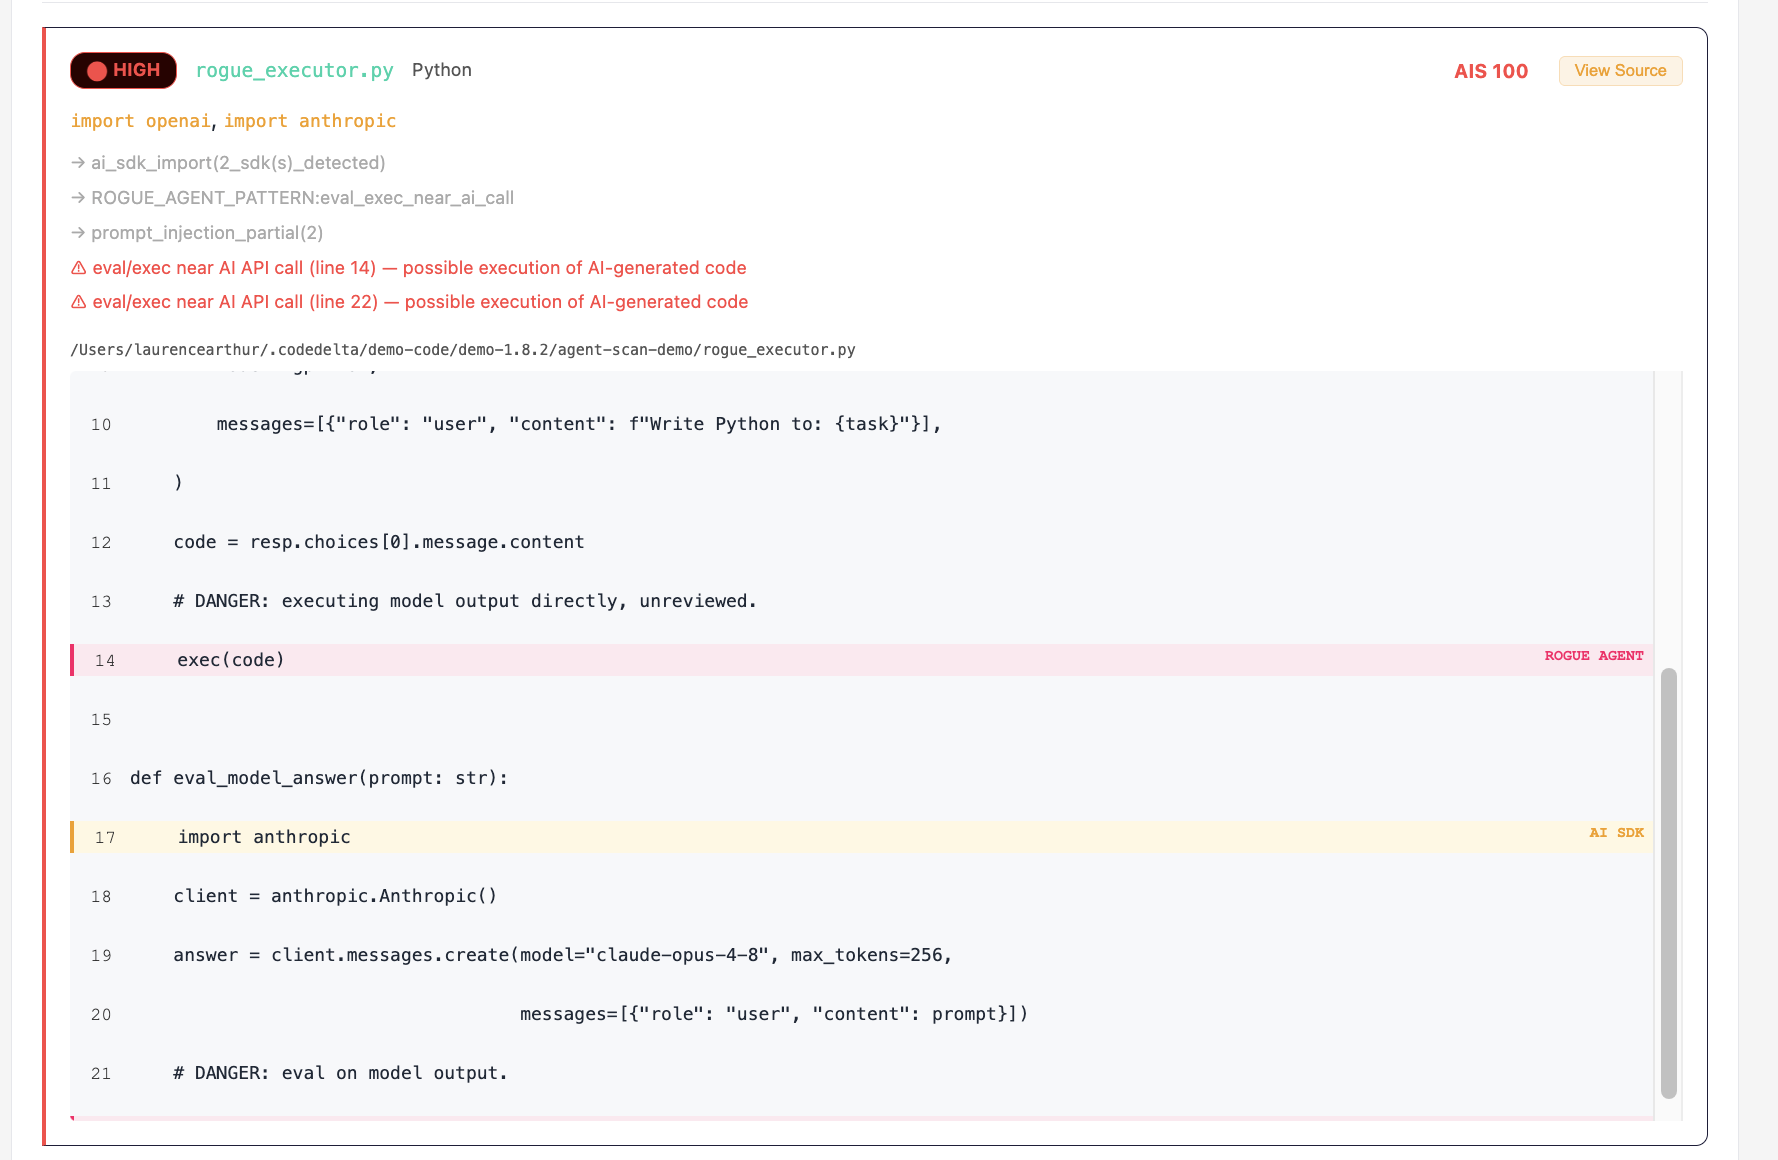
The agent-scan report. Flagged files ranked by risk, each with the reason — which SDK, which endpoint, which danger pattern — and a link to the source.
CodeDelta AI Agent Scan — the flagged source lines shown in context
The evidence. Click a flag and the flagged lines are shown in context, so the finding can be checked in seconds rather than trusted.
CodeDelta desktop app — agent scan results in the GUI
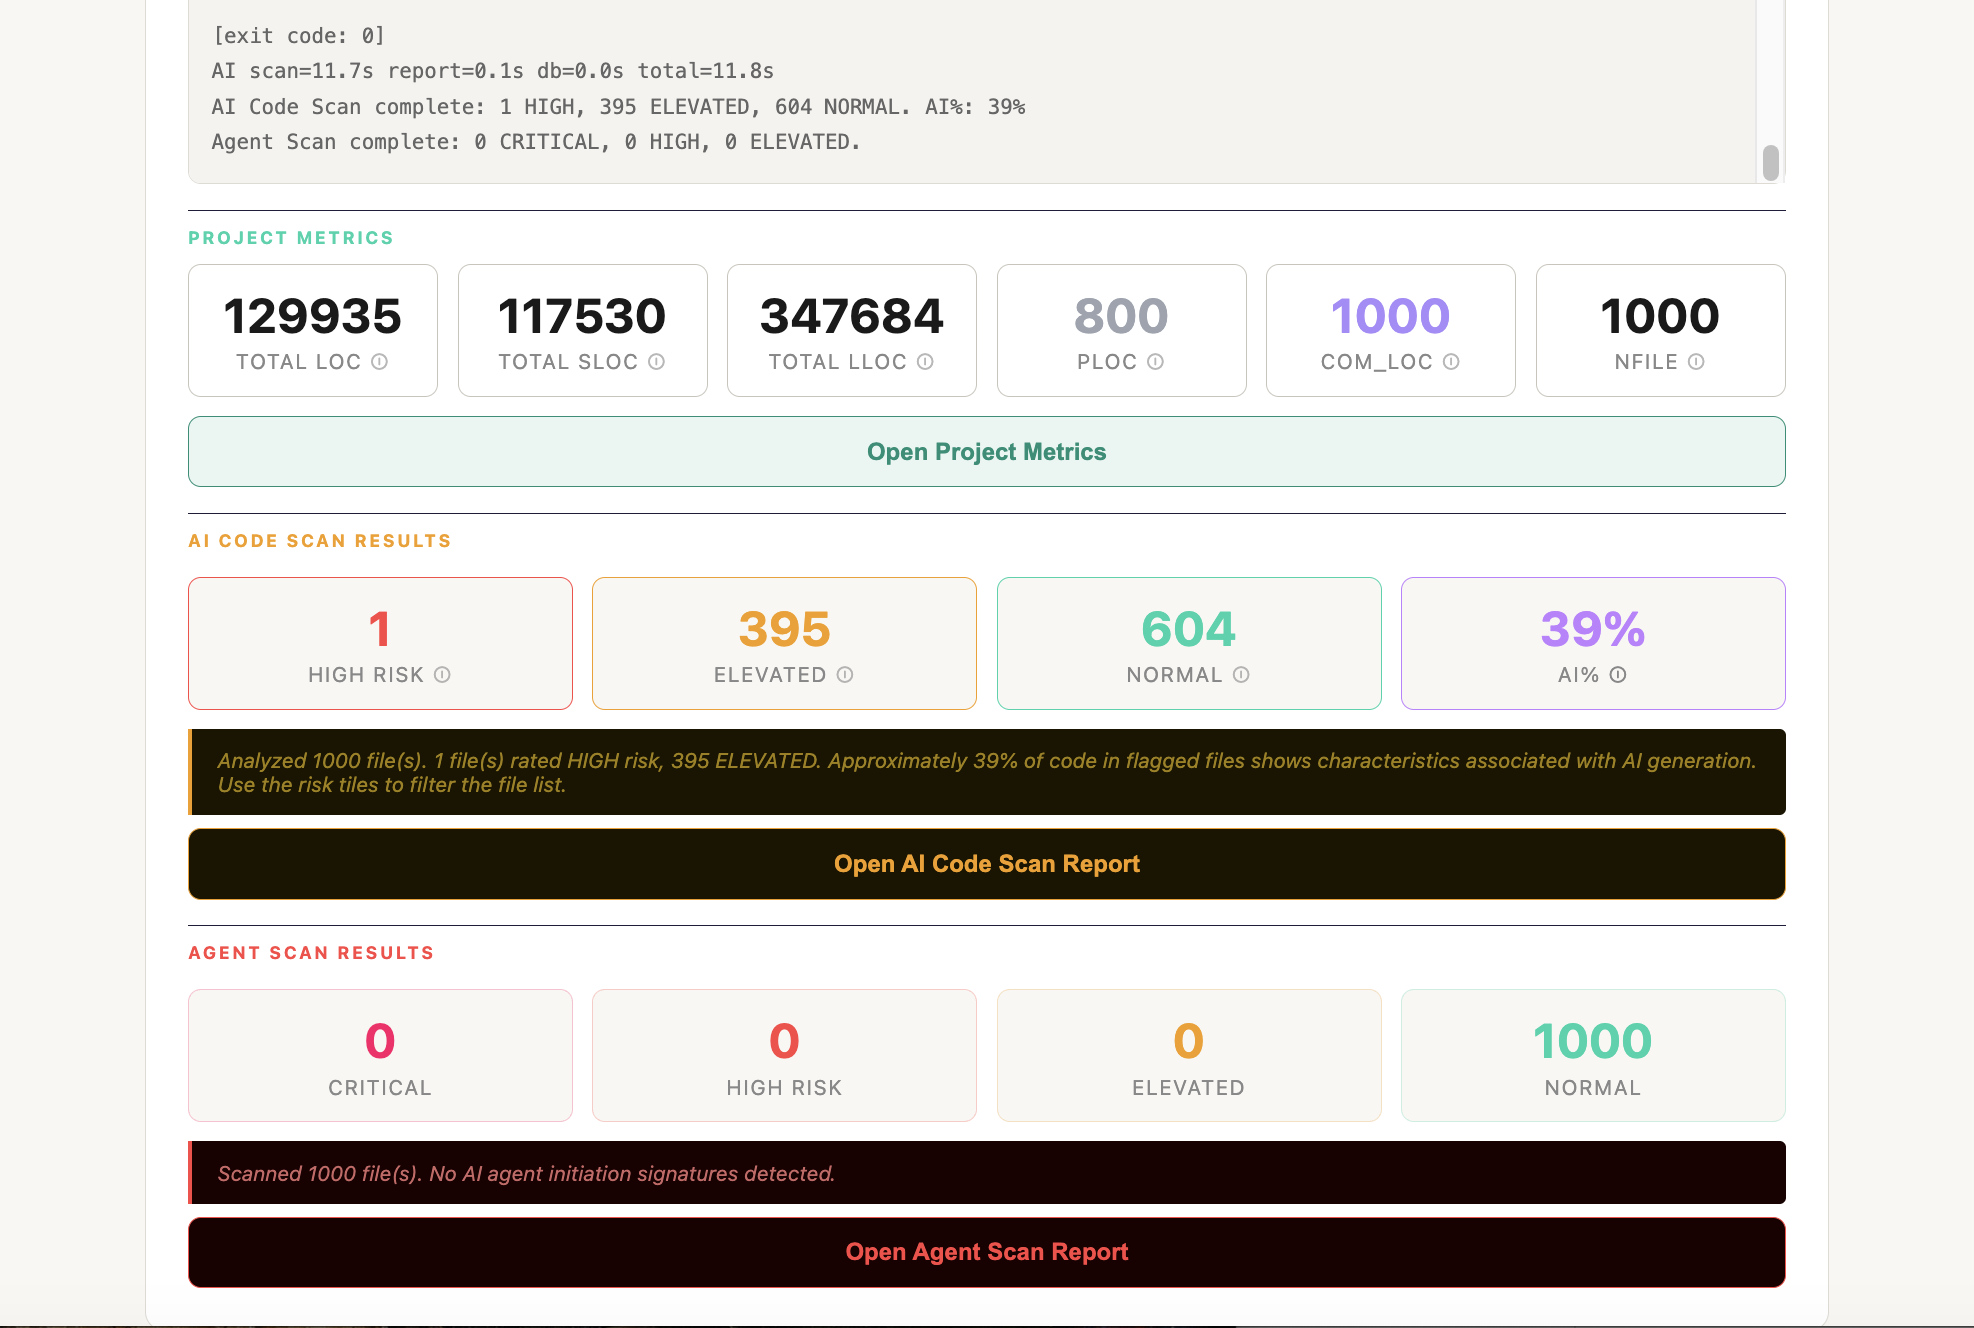
In the desktop app. The same scan from the app’s AI Agent Scan mode: one click, one local window, nothing leaves the machine.
CodeDelta Agent Map — agent files connected to the provider SDKs they call; providers in sovereignty-sensitive jurisdictions drawn in red
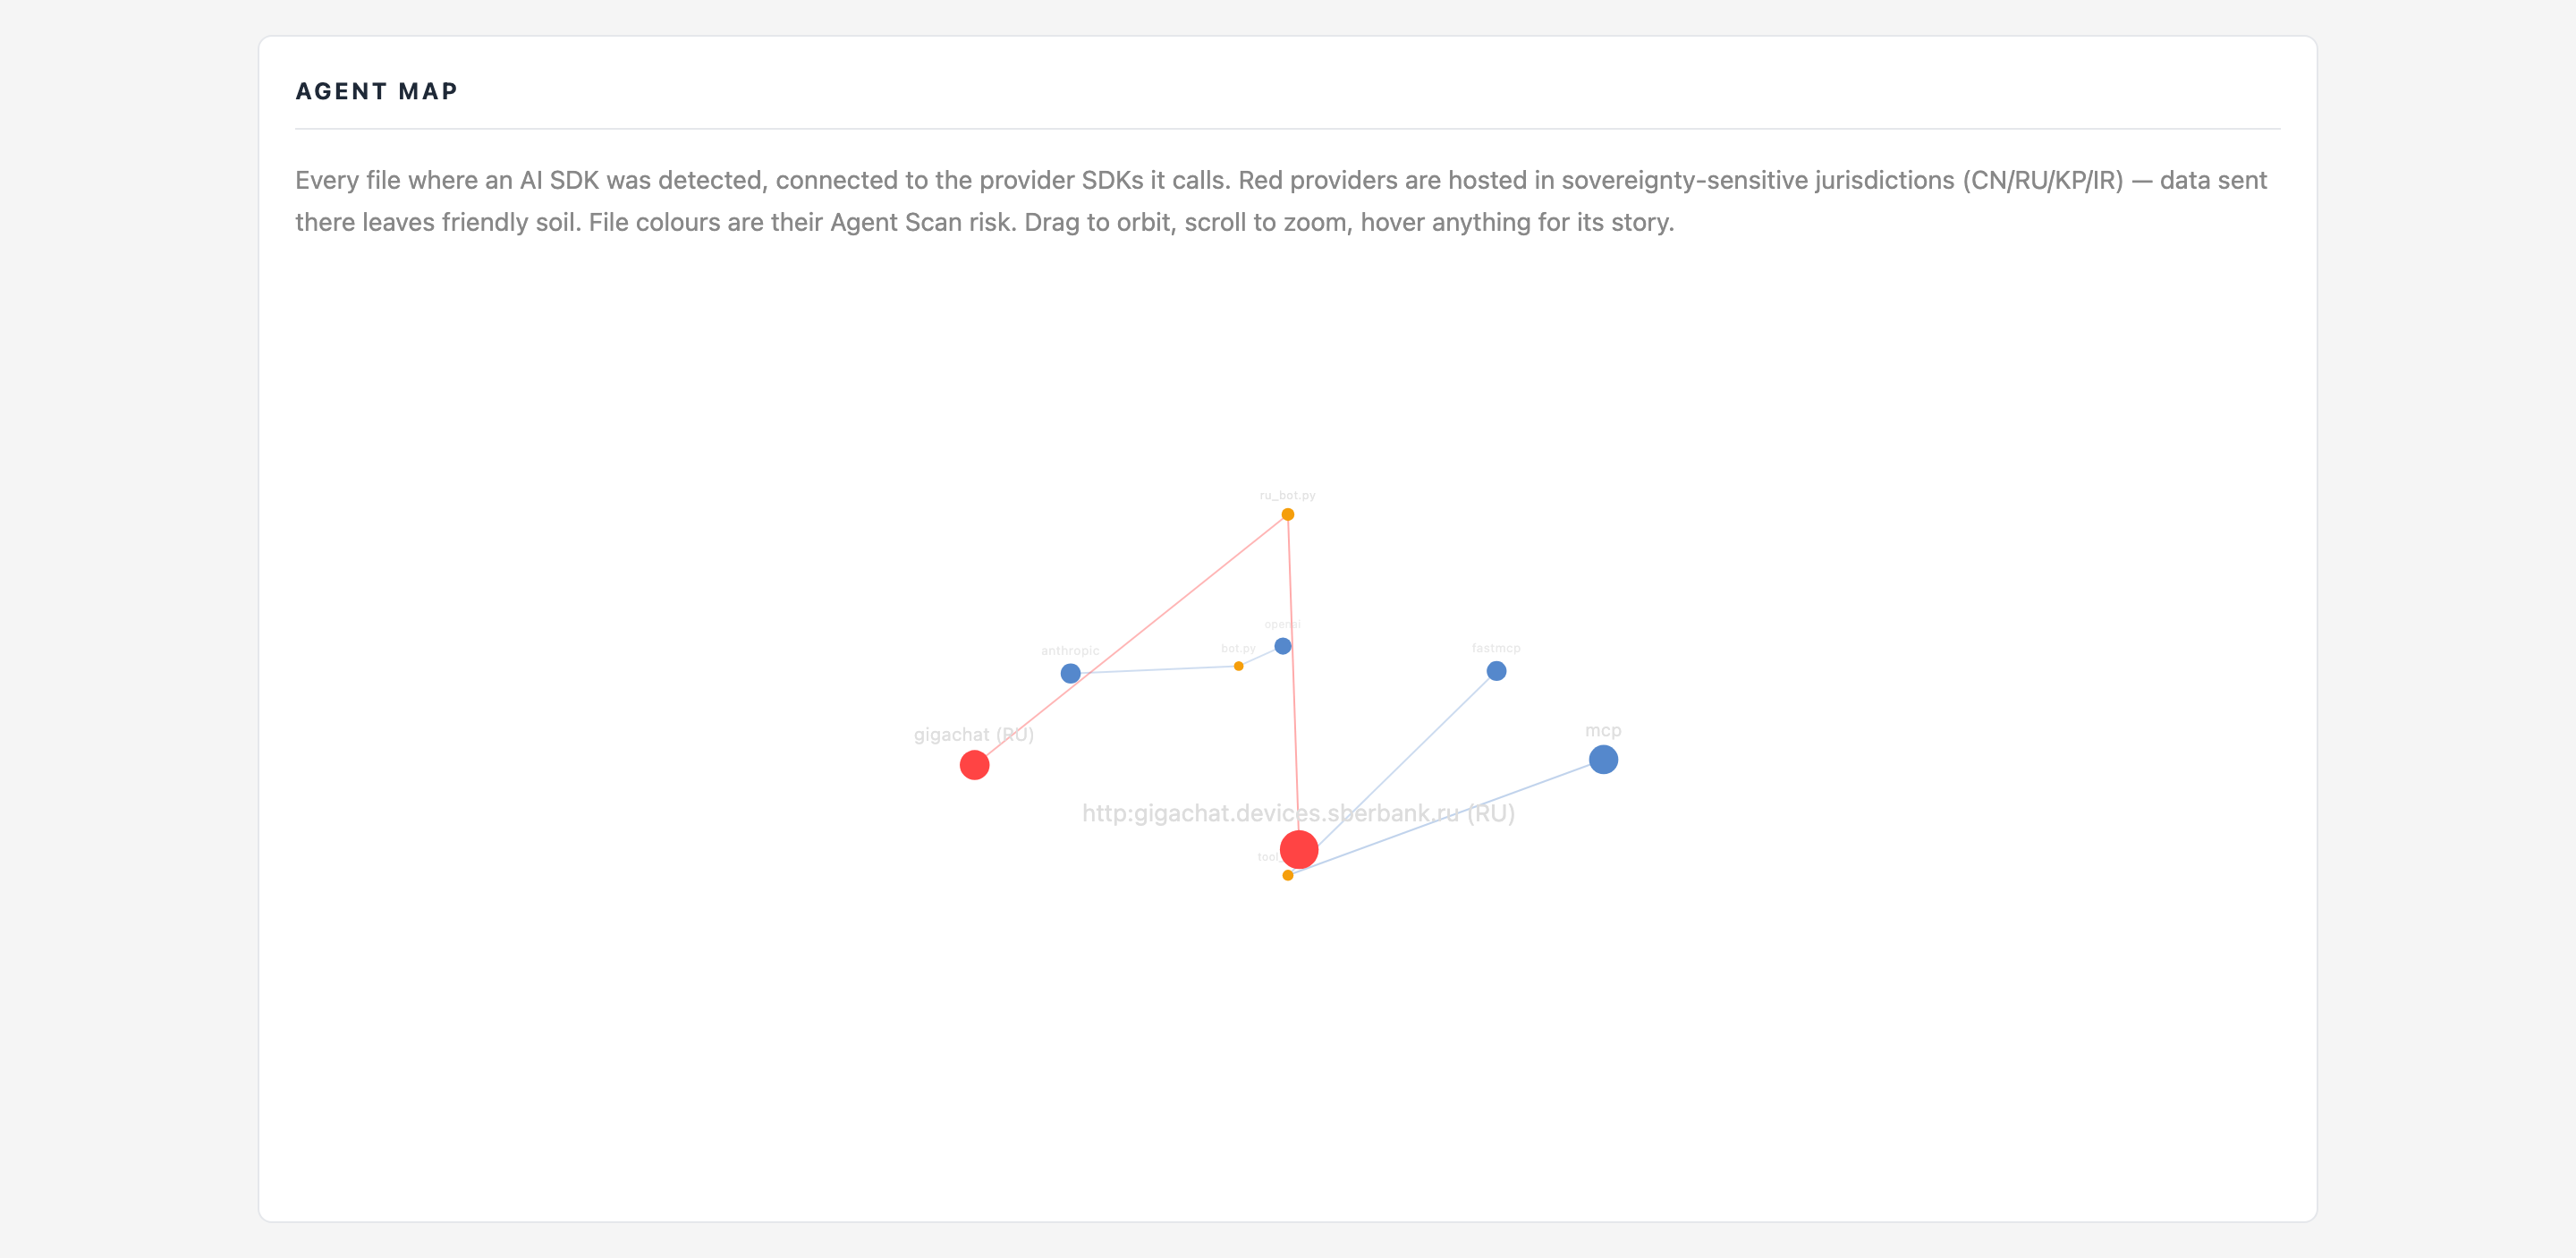
The Agent Map. Every file where an AI SDK was detected, connected to the providers it calls. Red providers sit in sovereignty-sensitive jurisdictions (CN/RU/KP/IR) — data sent there leaves friendly soil. Hover anything for its story.

Also in the box, without a picture: the AI bill of materials (native and CycloneDX) and the policy gate (--gate) that blocks unapproved providers in CI; the baseline that fails a merge only on new findings. CLI / CI reference.

Pointers, not verdicts

The AI Code Scan.

Files scored for generated-code characteristics — HIGH, Elevated, Normal — as a review aid. It tells you where to look first; it never claims to know who wrote a line. The paper says exactly what it can and cannot do.

CodeDelta AI Code Scan — 1,000 files scored: 1 HIGH, 395 ELEVATED
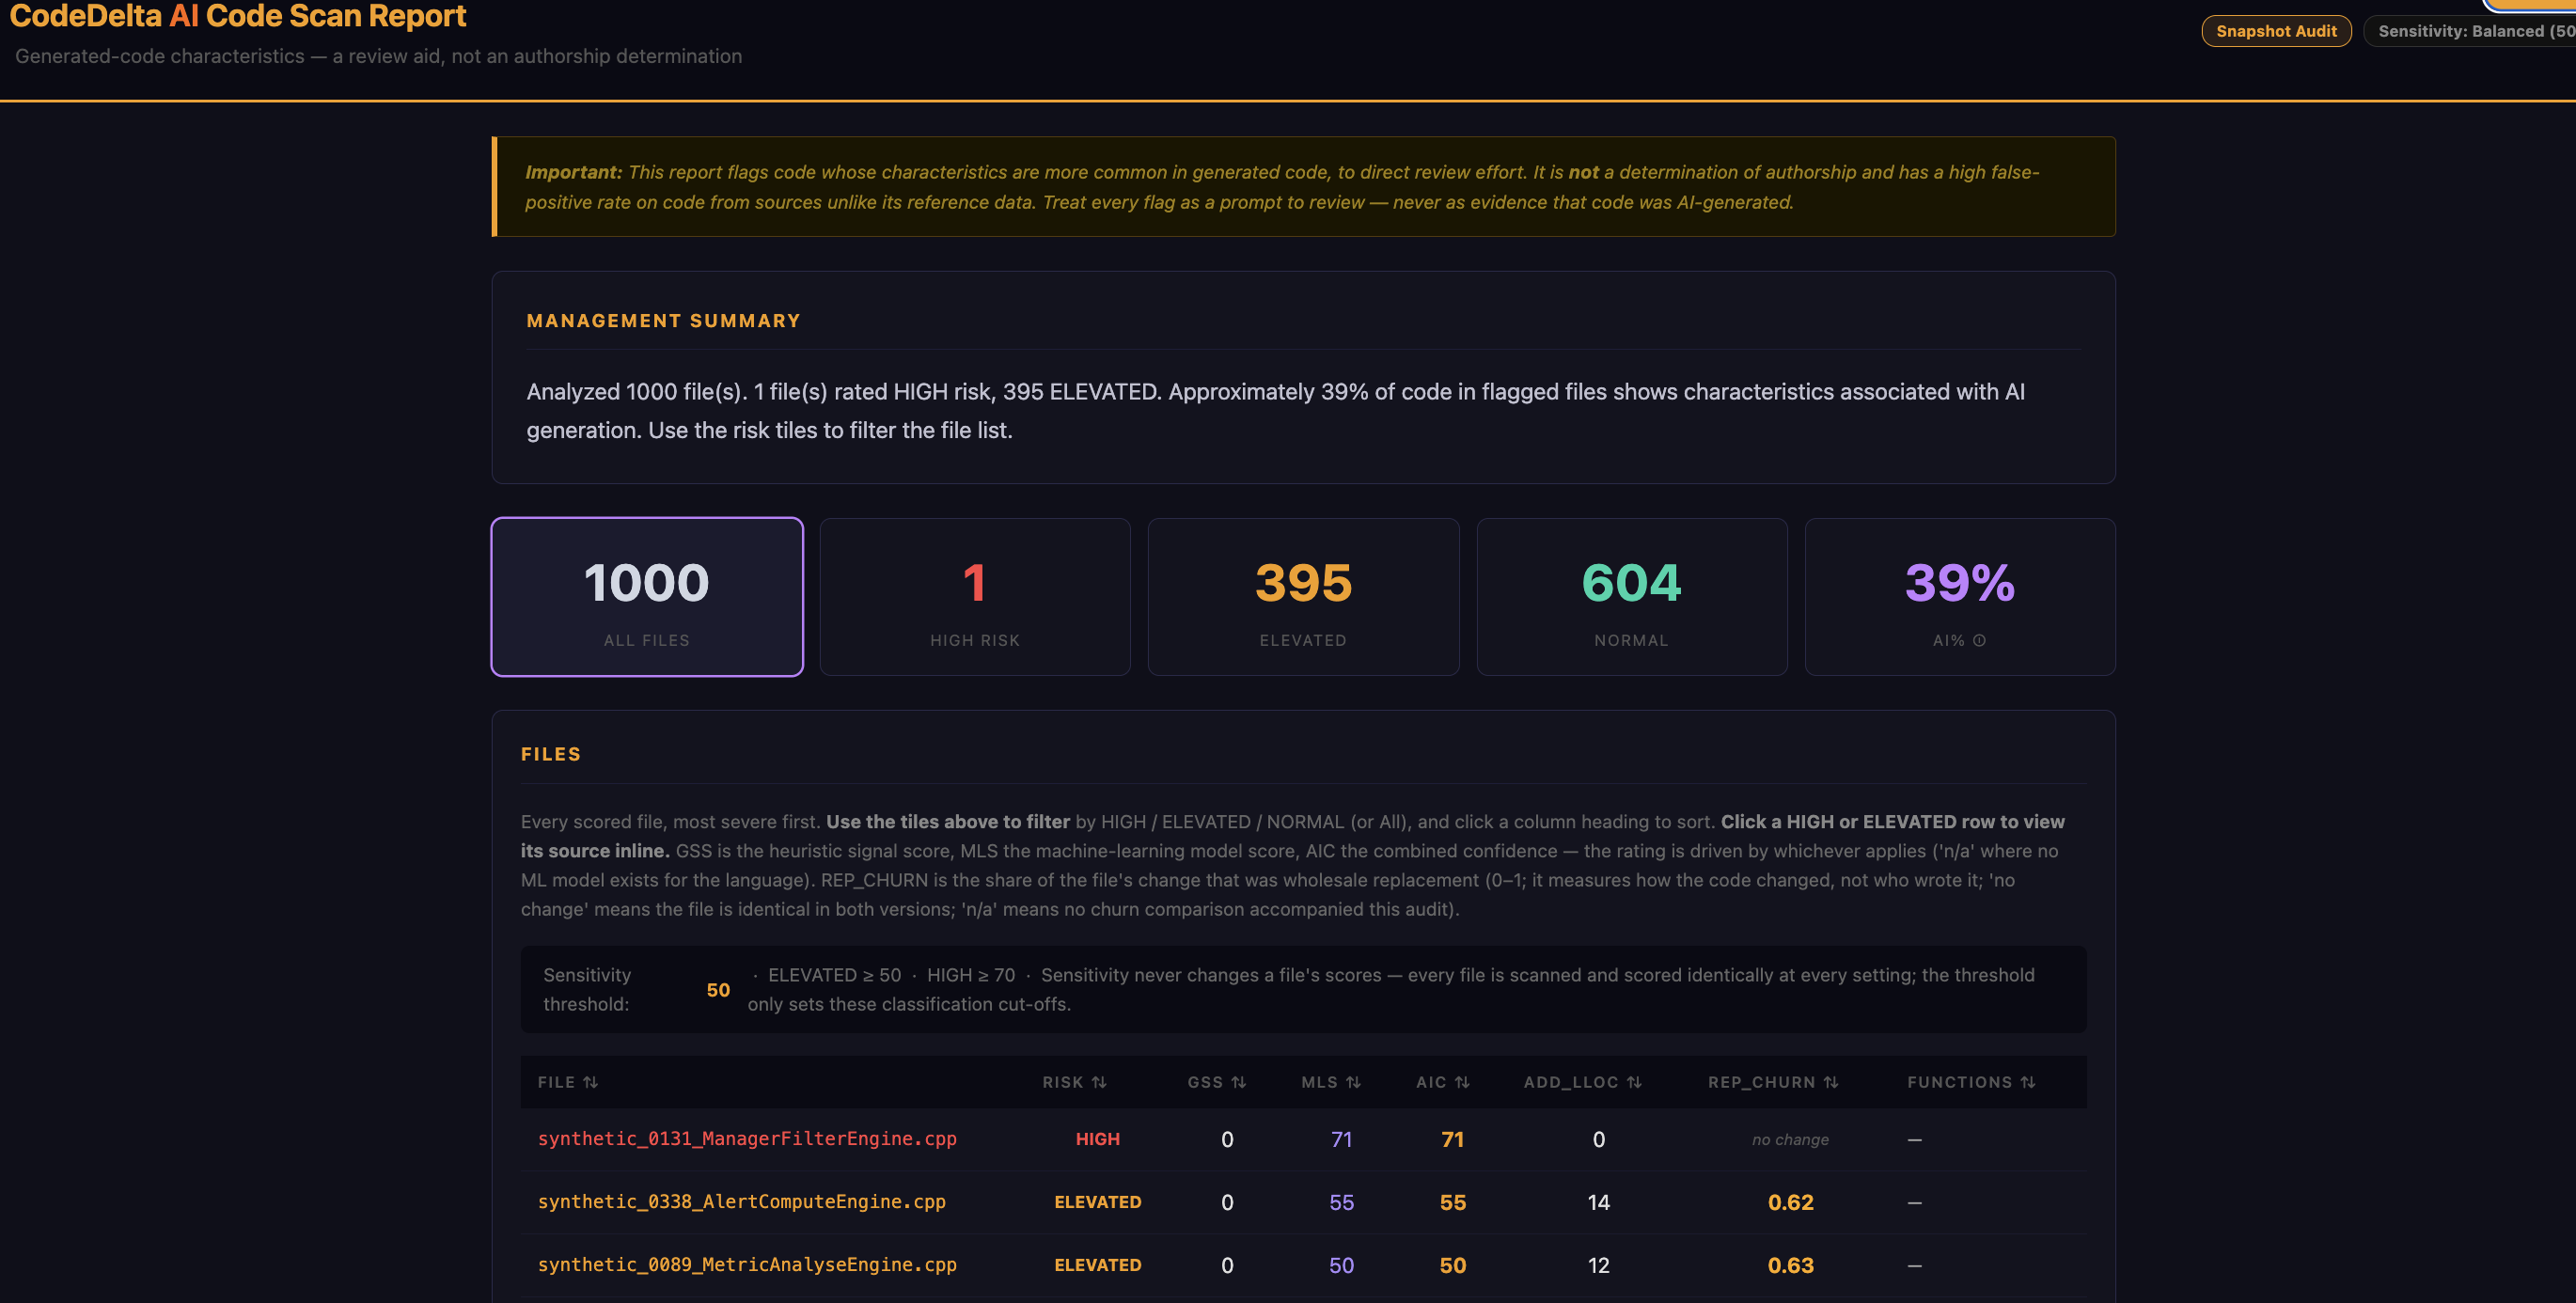
The AI Code Scan. 1,000 files scored — 1 HIGH, 395 ELEVATED, ~39% of flagged code showing generated-code characteristics. A review aid, never an authorship verdict.
Where it actually runs

In your pipeline.

Two lines in a workflow file. On every pull request, inside your own runner: the churn summary and agent findings as a PR comment, SARIF into the Security tab, and an optional merge gate. The engine downloads itself; a licence is built in for the beta.

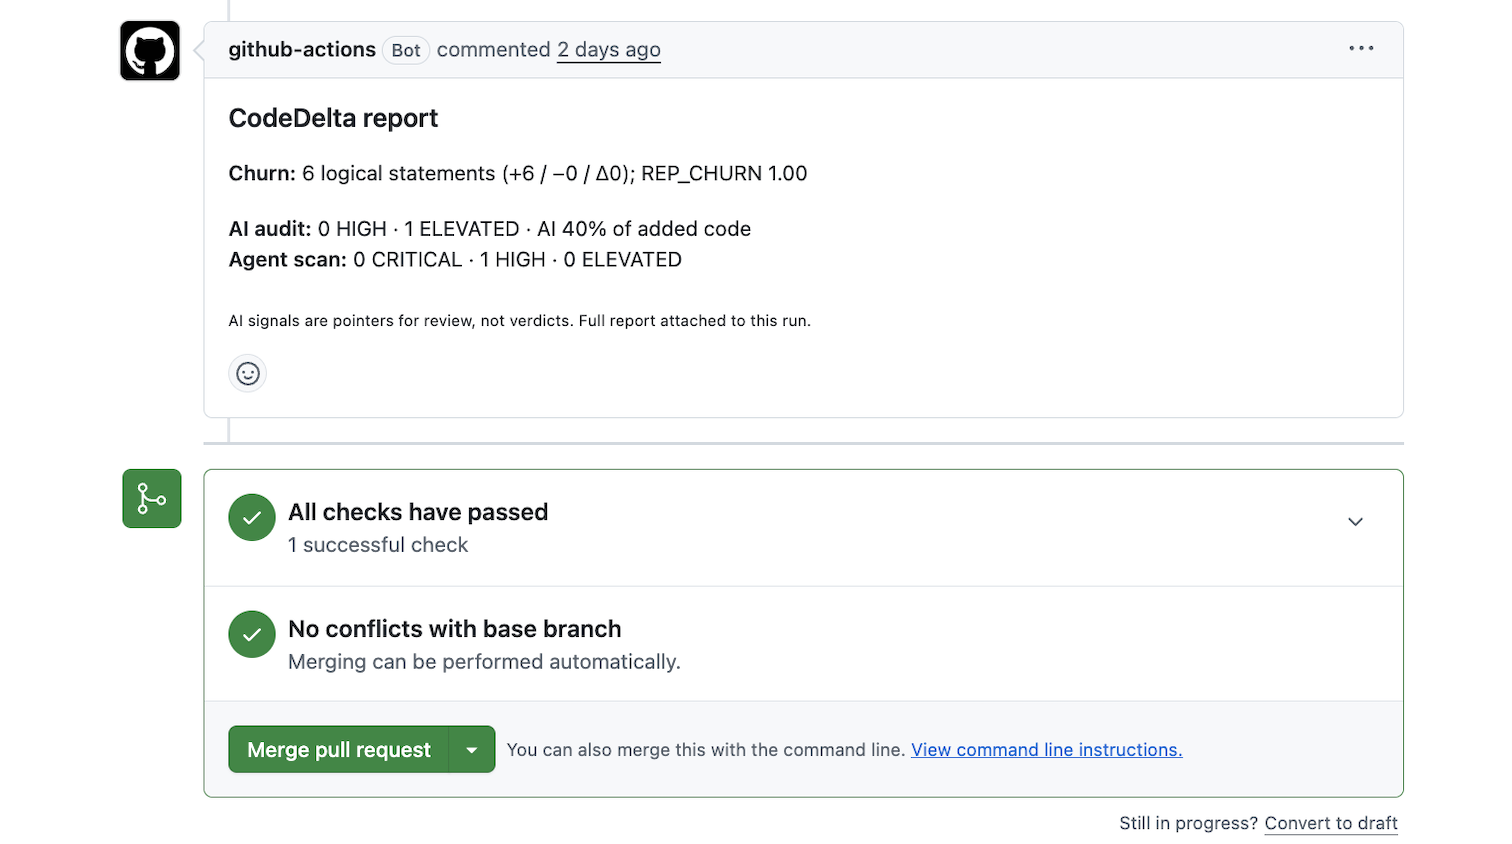
The CodeDelta PR comment on a pull request — churn summary, AI audit and agent-scan findings
The PR comment. Churn summary, TRUE_CHURN with the generated files named, agent findings — posted by the Action on the pull request.
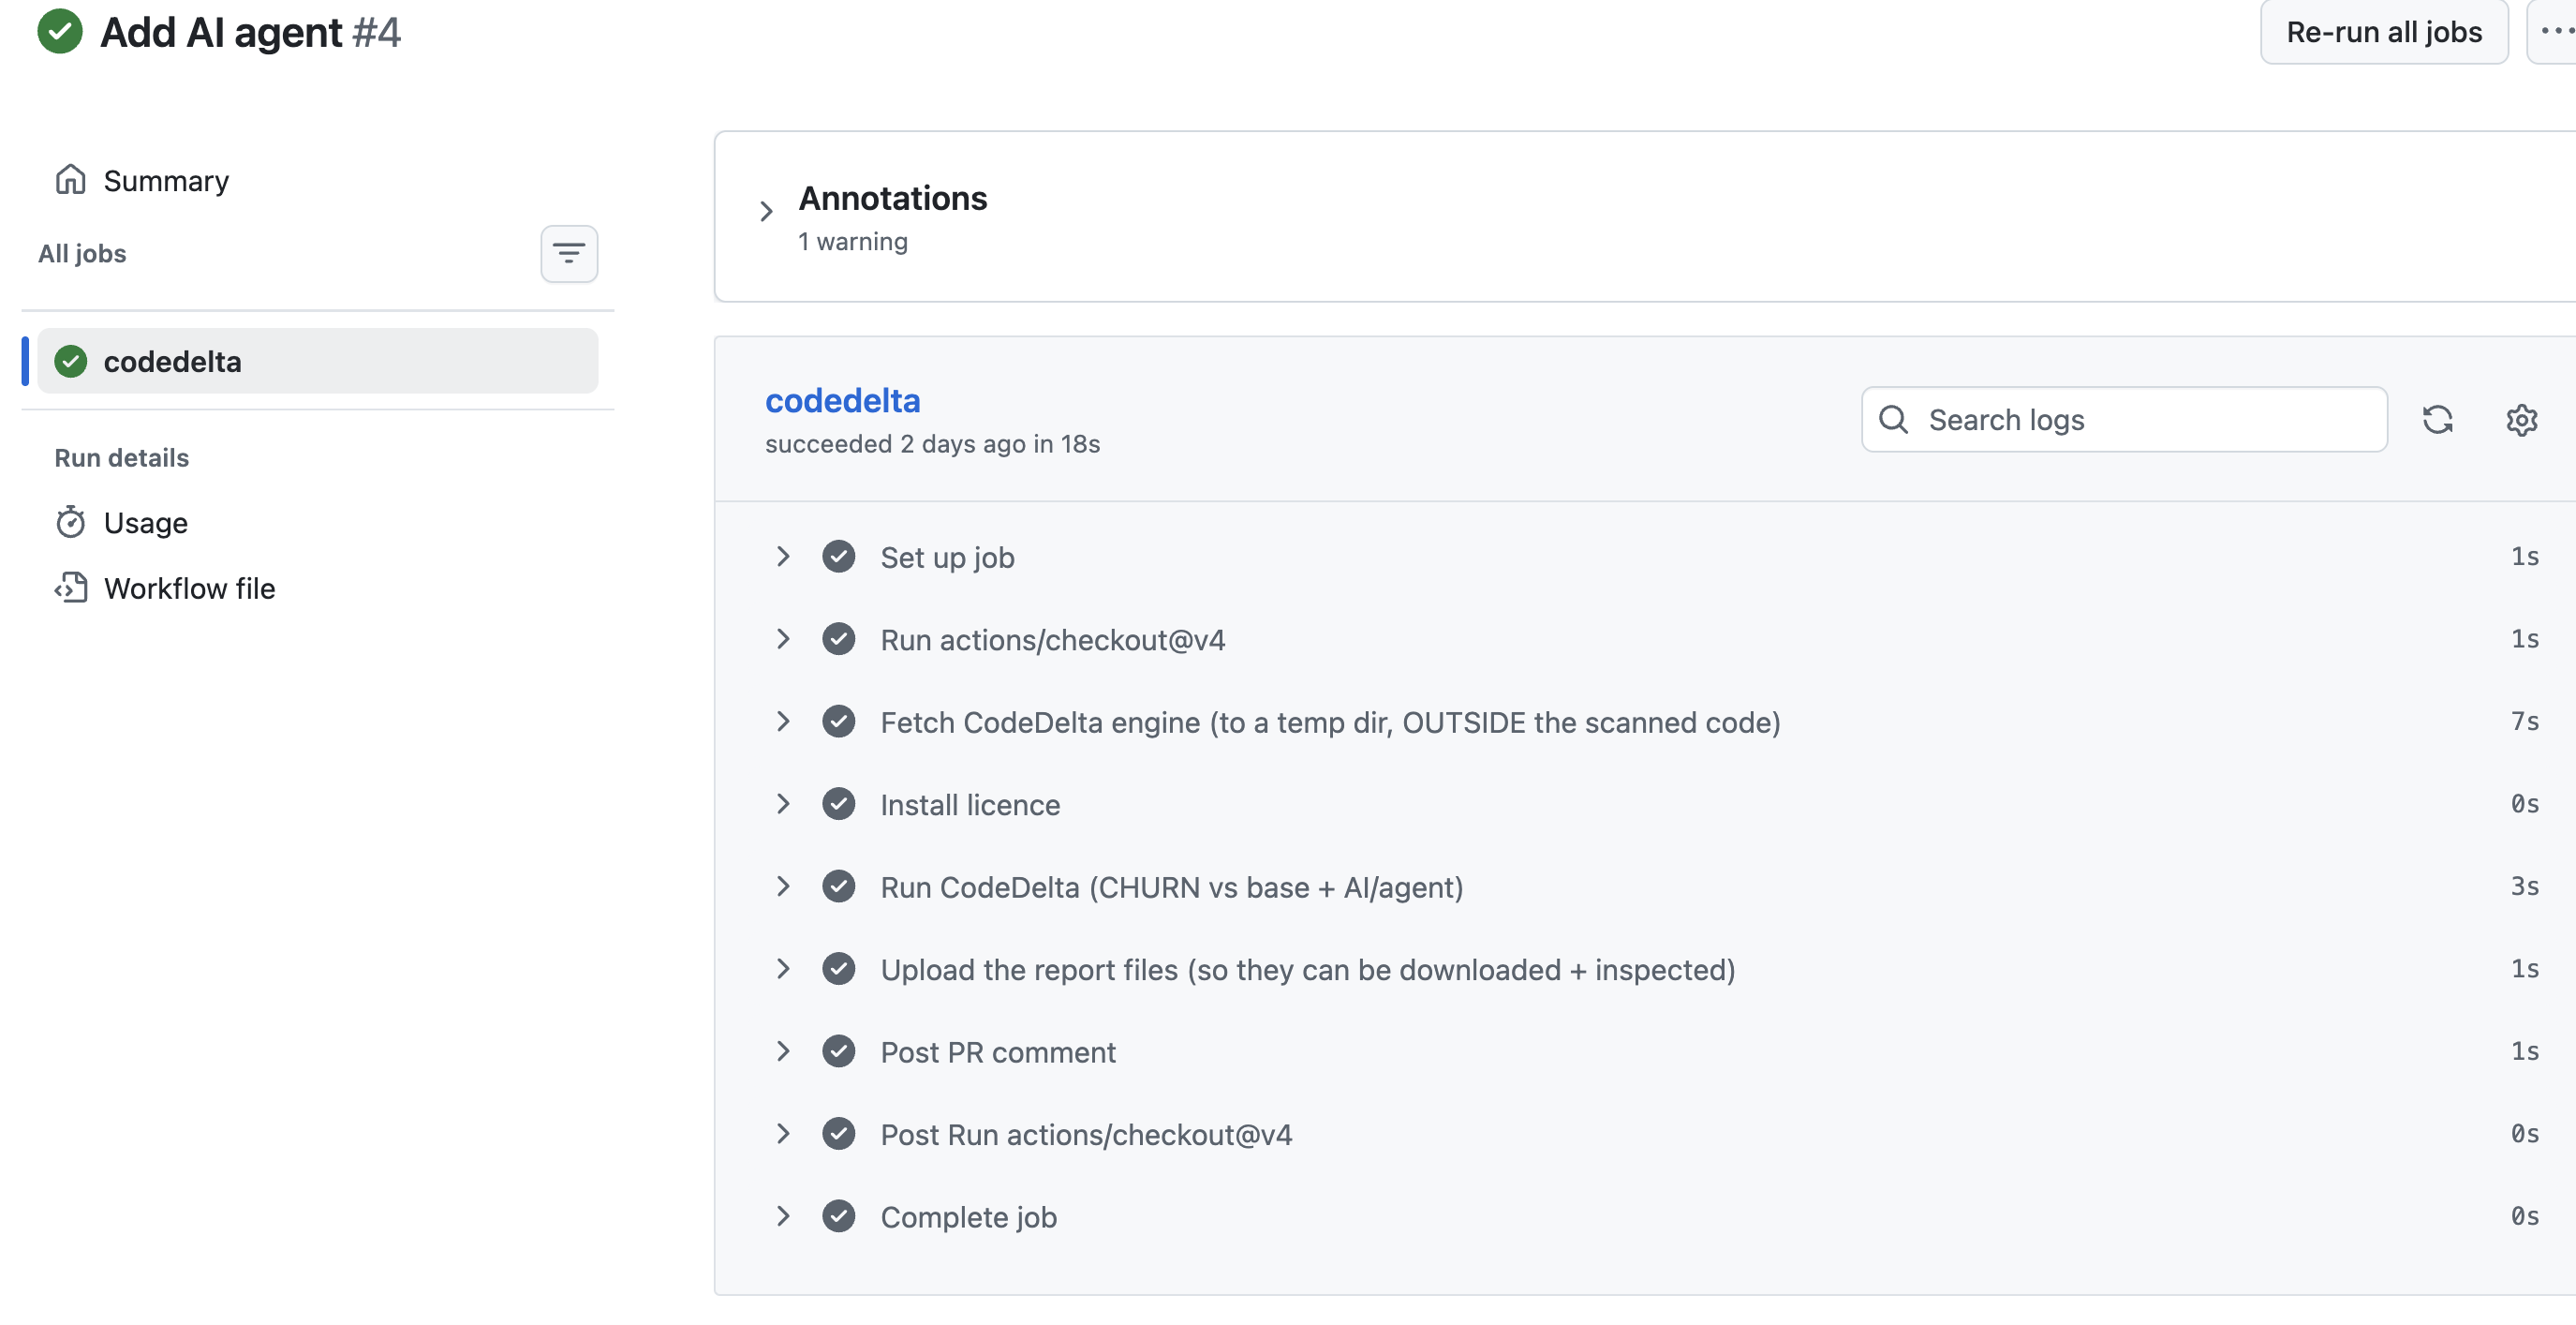
A CodeDelta GitHub Action run in the Actions tab
The run. The Action in the Actions tab: fetch the engine, install the licence, scan the diff, comment, upload SARIF, gate.

Set it up in five minutes · See it on a real PR · an MCP server lets your own agents call the engine (CLI / CI).

The app

The desktop app.

macOS, Windows and Linux. Pick a mode, point it at two snapshots or one project, and read churn, the AI code scan, the agent scan and the Code Browser in one local window — nothing phones home.

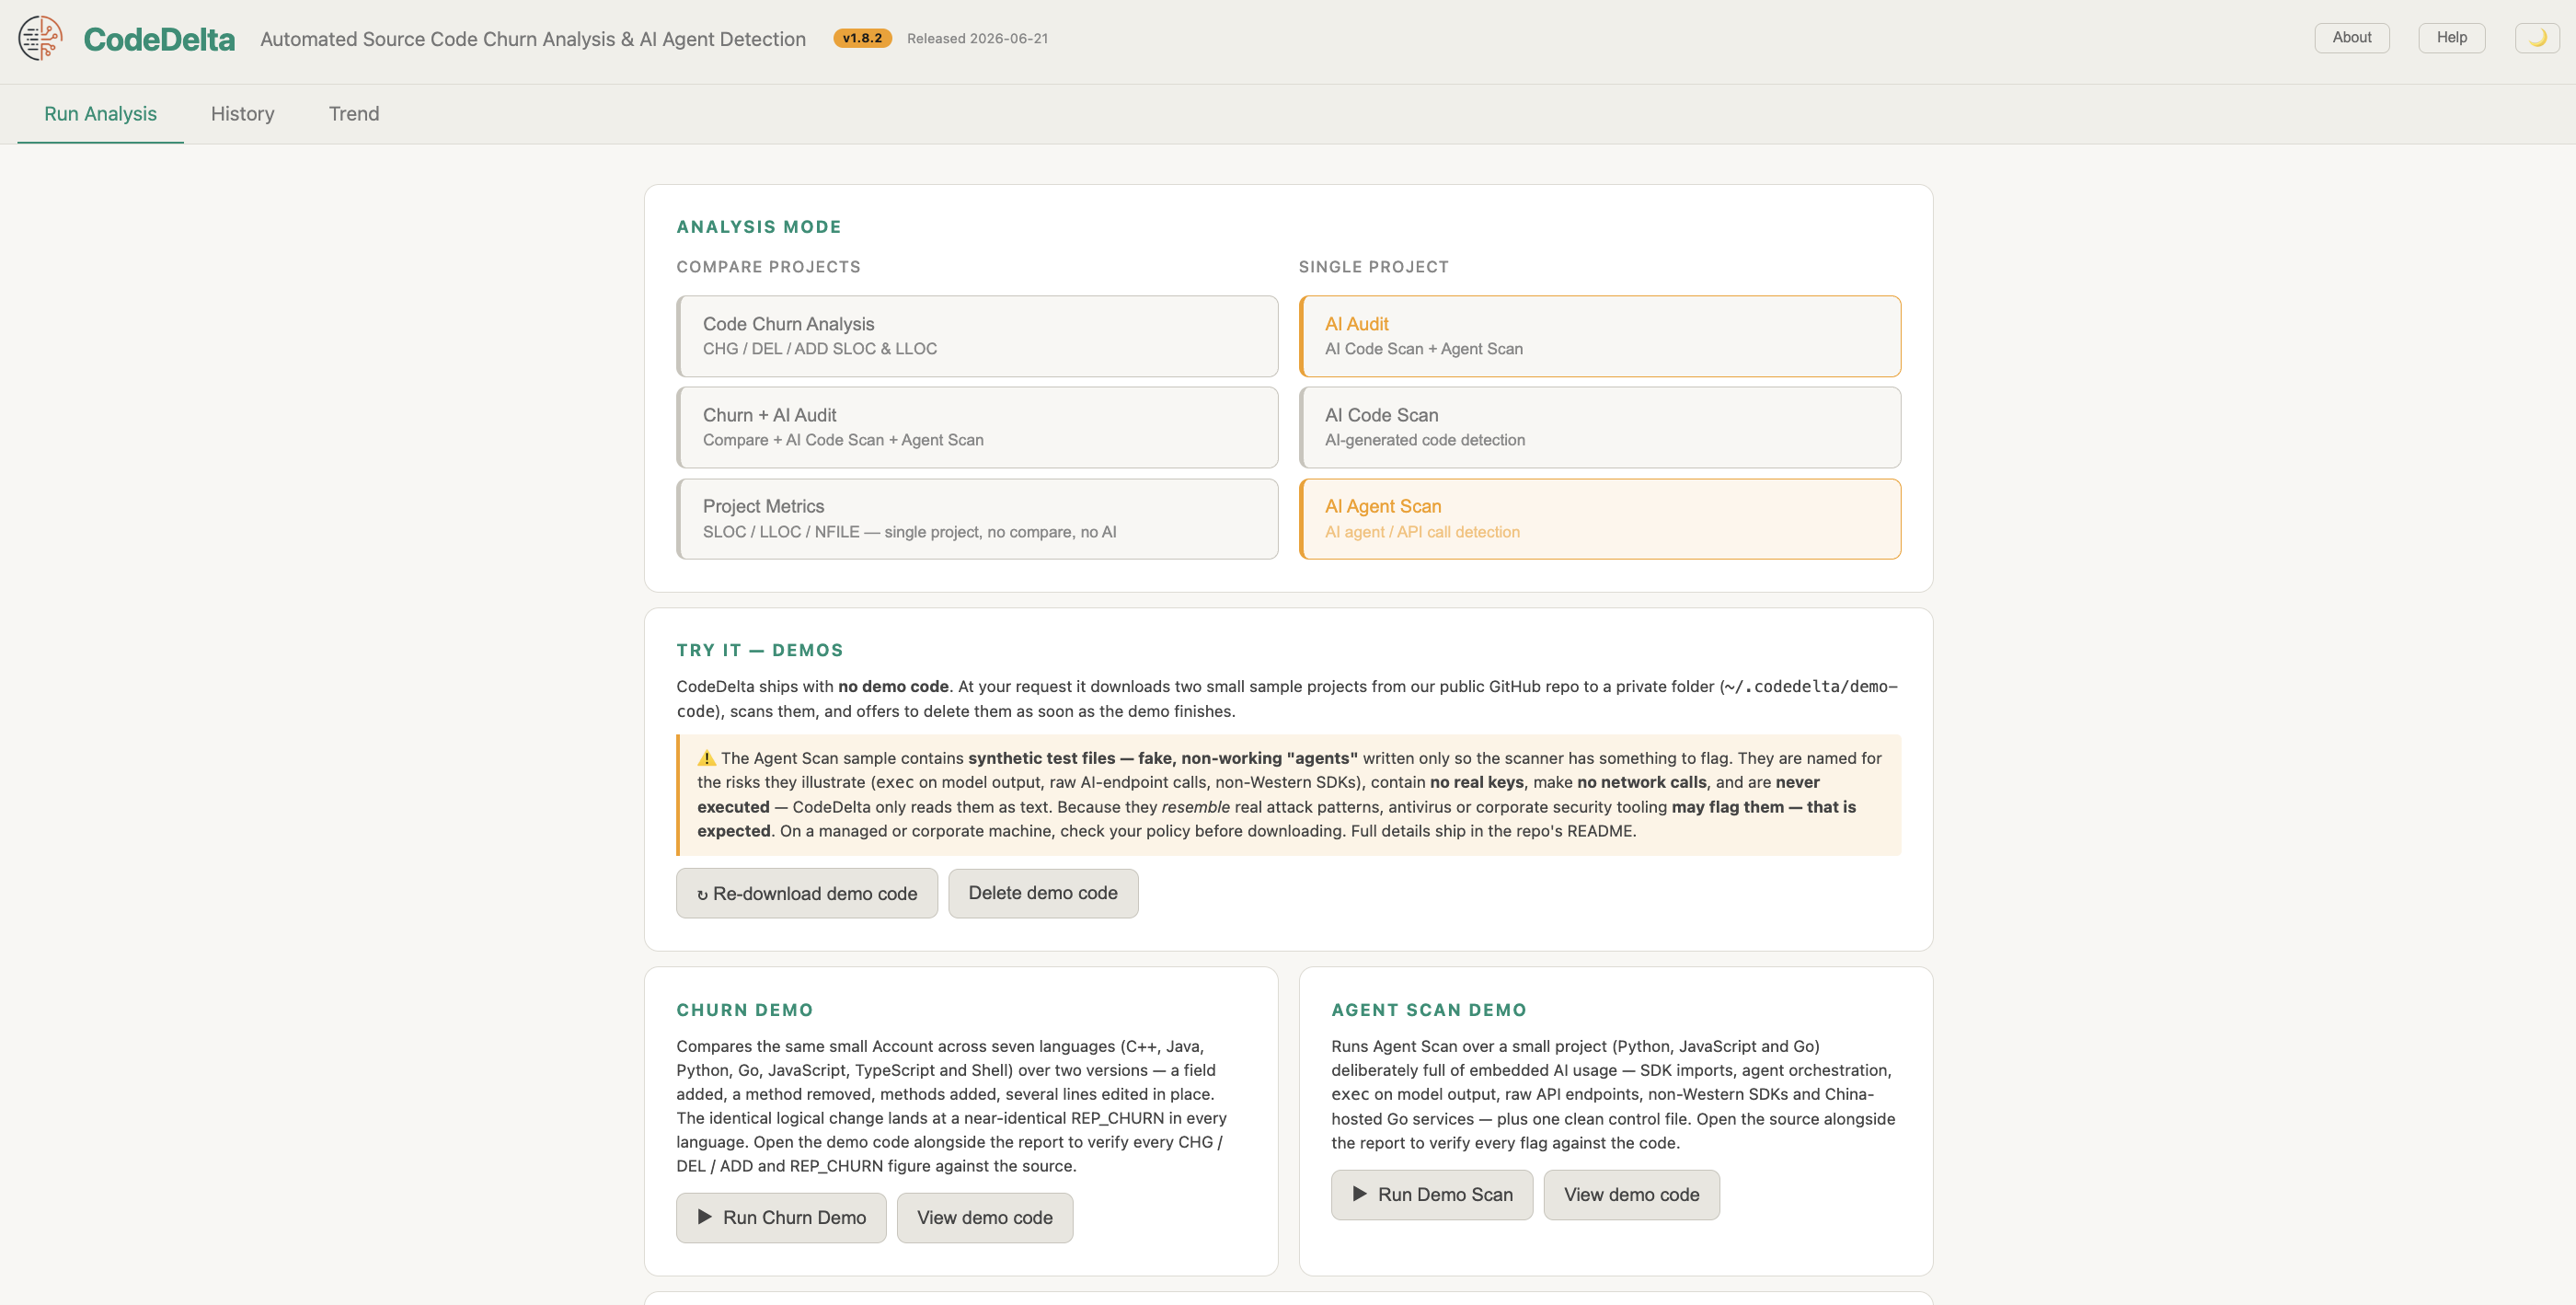
The CodeDelta desktop app — analysis modes, demos, and the results panel
The desktop app. Analysis modes on the left, the results panel on the right; Open Churn Report and Open Code Browser under every run.
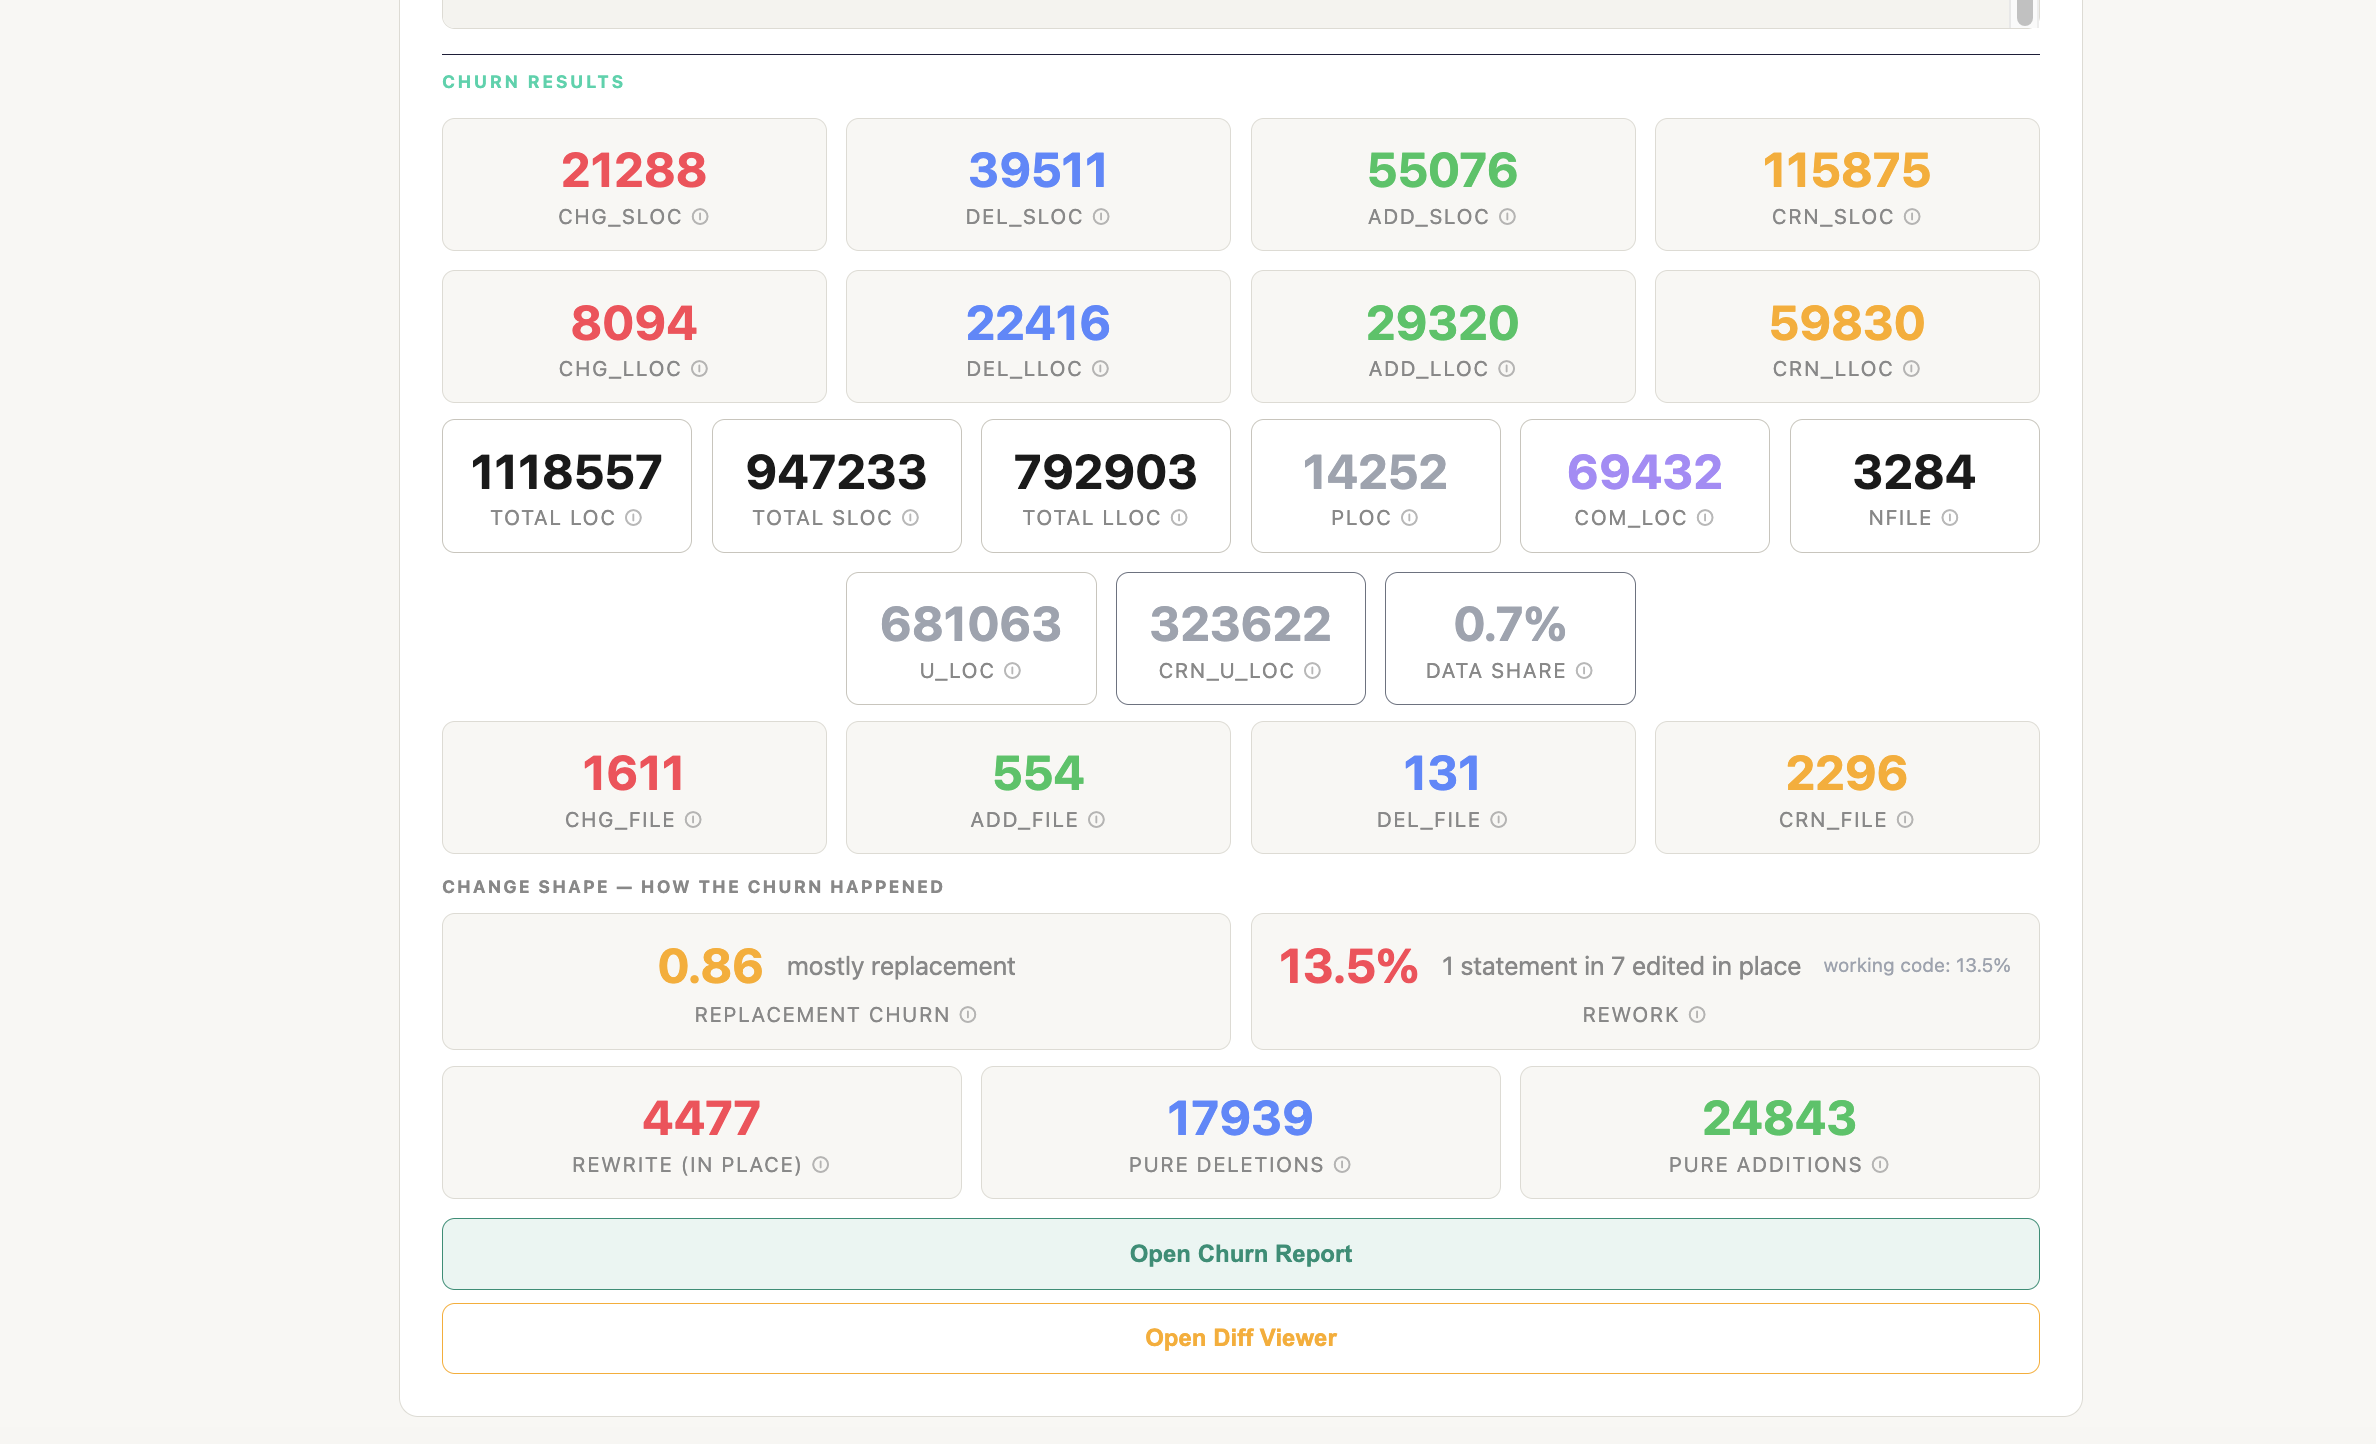
CodeDelta results tiles — CHG, DEL, ADD, TRUE_CHURN, REWORK and the rest
The tiles. Every counter with its definition one hover away — CHG/DEL/ADD, TRUE_CHURN, REWORK, generated churn, data share — and a button to the report or the Code Browser behind each number.

Free to evaluate until 31 October 2026, on every platform.

Try CodeDelta