All traces of AI activity on your desktop scanned and displayed with just one click!
Part of CodeDelta since release 2.2.0 · macOS, Windows and Linux · offline, nothing sent · the paper · a sample report
In July 2026 Sophos watched Claude Code, Cursor and Codex at ordinary work on developers’ machines. More than half of what its endpoint rules blocked was credential access: decrypting browser passwords, listing the Windows credential store. A year earlier a poisoned npm package turned the same agents into credential hunters, and 2,349 secrets leaked.
Every one of those runs was written to a log on the developer’s own disk. Once installed, Agent Tracer can read it and tell you everything! One click, and every session on the machine is on one page, with what it ran, deleted, pushed and sent, to which hosts, and what you refused.
Try CodeDelta SEE A REPORT →- One click. Pick the AI Agent Tracer mode and press Run. No setup, no collection agent, no account.
- Six agents read. Claude Code, OpenAI Codex, Cursor, GitHub Copilot CLI, Gemini CLI and Antigravity, from the logs they already write.
- Nothing leaves the machine. It reads files and writes one HTML report and three CSV files. It sends nothing.
- Every figure traces to a command. The rule is printed beside its count; the exact command, its time and its session sit one click under it.
- Before the log is gone. Claude Code deletes its session logs after thirty days by default. The report keeps what it found.
- Tested on 3,900 public agent runs. The study and the paper set out the method and its limits.
What one click produces
What the report shows
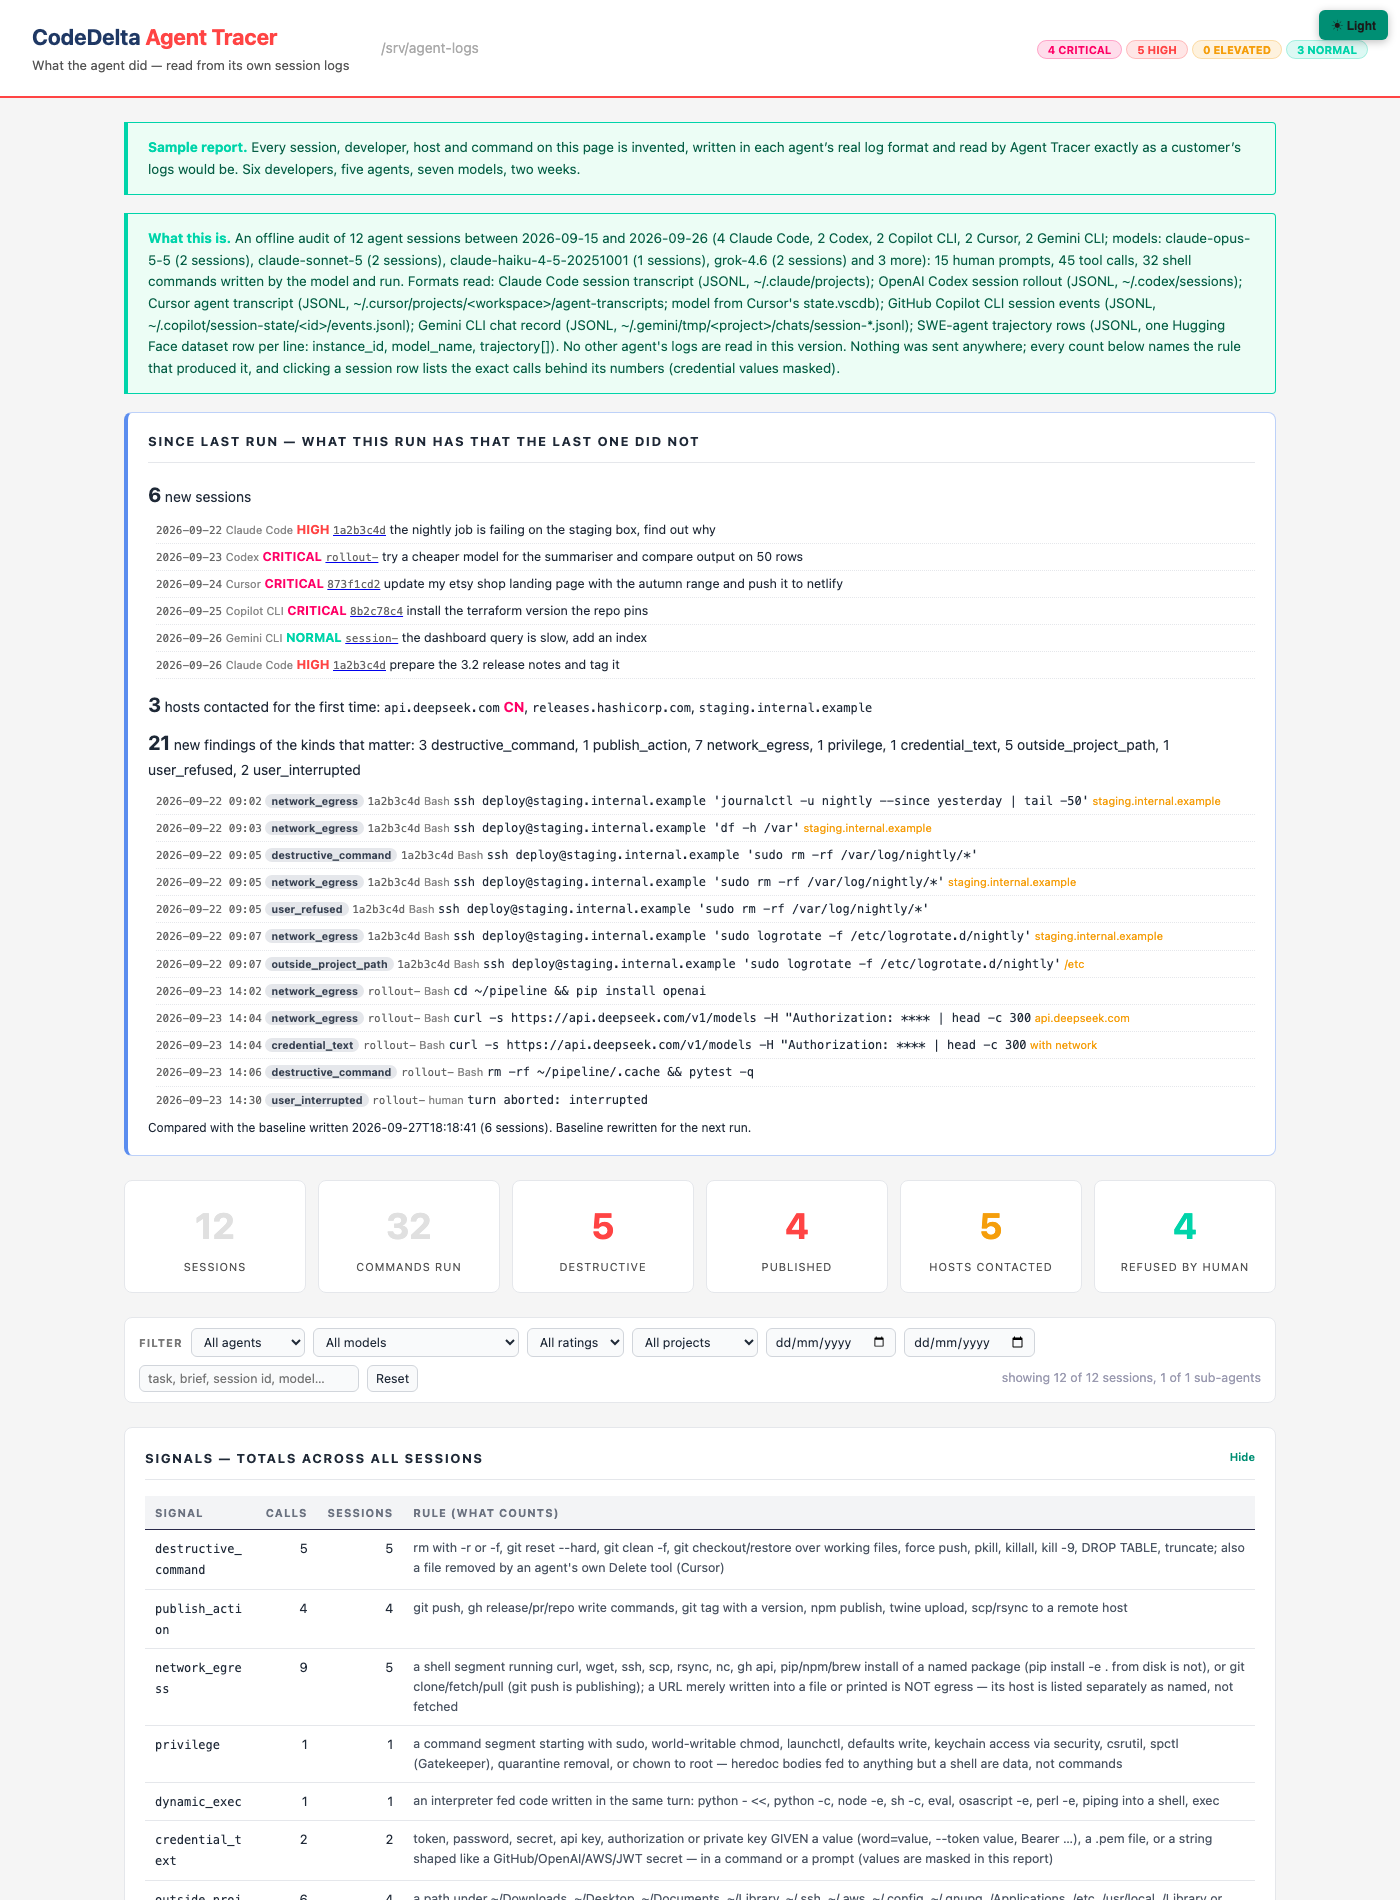
Each session is reconstructed from its log: the human’s prompts, the model’s turns, tool calls paired to their results, the sub-agents the tool spawned, and the model in charge at each moment. Every shell command the model wrote and ran is then judged by a fixed set of rules, each stated in words on the report beside its count.
| Signal | What counts |
|---|---|
| Destructive | rm with -r or -f, git reset --hard, git clean, force push, pkill, kill -9, DROP TABLE |
| Publishing | git push, releases, pull-request writes, version tags, npm publish, scp or rsync to a remote host |
| Network | curl, wget, ssh, package installs, git clone, any URL; the hosts reached are listed, with the country where the Agent Scan’s provider table states it |
| Privilege | sudo, world-writable chmod, launchctl, keychain access, Gatekeeper and quarantine changes |
| Dynamic execution | an interpreter fed code written in the same turn: python -c, node -e, sh -c, eval, piping into a shell |
| Credential text | a token, password, secret, key or authorization header given a value, a private-key file, or a string shaped like a known secret; the value is masked in the report |
| Outside the project | a path under Downloads, Documents, Library, .ssh, .aws, /etc, /Applications or the like, named in a command or written to |
| Refused, stopped, blocked | a call the human turned down at the permission prompt; a turn the human interrupted; a call stopped by a hook or policy rather than the human |
| Repeated | the same command run three or more times in one session |
Each session receives one of four ratings, CRITICAL, HIGH, ELEVATED or NORMAL, from a rule printed on the page. The rating means a person should look, not that harm occurred: the exact command, its time, its model and its session sit one click under every figure, and a credential’s value is never shown. Three further parts answer what the counts cannot: what each session was for, in the human’s own first words; which model was in charge and what each model did, including how many of its turns were sub-agents the tool spawned on its own; and what changed since the last run. Filters by agent, model, rating, project, date and text keep a team’s worth of sessions readable on one page, and three CSV files beside the report carry the same figures into a spreadsheet.
Who it is for
Individuals. A developer a month after the work, asking what the agent actually ran, which folders it wrote to outside the project, which hosts it contacted, and what they themselves refused at the permission prompt. The log answers all of it; the report makes the log readable.
Project managers. Five developers running agents on one codebase. The report lists every session with the first thing the developer asked, the model that did the work, and its rating, filtered by project and by week. A session whose task line and project folder have nothing to do with the team’s code says so without anyone opening a log.
IT departments. Every host the agents contacted, with the jurisdiction where the provider table knows it; every privilege change; every credential that appeared in a command, masked; every path outside the project. Logs are collected with the agents’ own settings and hooks, read on a folder the organisation controls, and nothing is sent anywhere by the tool.
Software quality experts. One rating per session from a rule printed on the page, the sub-agents each model spawned and what they were asked, the commands repeated three or more times, and the delta against the previous run. Every figure on the page traces to the command that produced it, so the finding can be checked rather than trusted.
What it reads
The session logs of Claude Code, OpenAI Codex, Cursor, GitHub Copilot CLI, Gemini CLI and Google’s Antigravity, detected per file from the first record, with sub-agent transcripts folded into their parent session. Other agents’ formats are not read, and the report says so. By default it looks in the folders those agents use under the user’s home; point it at any folder the logs were copied to and it reads that instead.
Where it runs
In the desktop app: choose the AI Agent Tracer mode, leave the folder as this machine or pick a collected folder, and press Run. The report opens like any other CodeDelta report.
At the command line: the same bundle, headless, for a scheduled weekly run over a folder the logs are collected to. The report leads with what is new since the previous run.
codedelta-gui scan <logs-folder> --mode tracer --out-dir <dir>
It is not a pull-request tool. The logs live on the machines where the agents ran, so Agent Tracer runs there or on a folder they were collected to, and has no place in the GitHub Action. Where every CodeDelta tool runs is on the tools page.
Limits
The rules are pattern matches. They cannot tell a justified deletion from a mistaken one, and the judgement happens on the line under the number. The task line is the first prompt of a session, so a session that starts on work and drifts elsewhere reads as work unless every prompt is listed. The paper sets out the limits in full.
READ THE PAPER → THE STUDY: 3,900 PUBLIC AGENT RUNS → THE SAMPLE REPORT →
Agent Tracer is included in CodeDelta 2.2.0 and later, on macOS, Windows and Linux, and runs under the same licence as the rest of the tool. It reads files and writes one HTML report and three CSV files. It sends nothing.