 code·delta
User Guide & Technical Reference
code·delta
User Guide & Technical Reference
Automated Source Code Churn Analysis & AI Agent Detection
.claude, .vscode, .husky, .devcontainer and the like; until now every dot-folder except .github, .gitlab and .circleci was skipped); only dependency, version-control, virtual-environment and cache folders are left out, and the guide lists them. Lock files and source maps are read as text and no longer counted as binaries; SVG images get the JavaScript rules on their script blocks, like an HTML page; a shell script without an extension (a git hook) is recognised by its first line.helpdesk/assets/banner.png, an image with an agent hidden after the picture data (CRITICAL), and badge.png, a plain image (NORMAL). 93 files, 32 CRITICAL.%USERPROFILE%\.codedelta\codedelta.log.scan options --snapshot-date, --exclude, --ext and --metric-set make every setting reachable from the command line; a test runs each mode both ways and requires identical results. AI Agent Scan and AI Audit modes: same findings; the project size figures appear on screen only. The Agent Tracer shows no command.scan now keeps its database in the output folder (<out-dir>/<name>_run.db), never in the scanned project, and the Agent Scan skips CodeDelta’s own output folder and database when they are inside the scanned tree. In the desktop app an emptied Database field means the default database._0x… identifiers, the signature of javascript-obfuscator. Measured on 14 hijacked npm and PyPI releases and 142 clean packages; see the Agent Scan points table.--include-dist: the Agent Scan, the credential check and the build-file map also read dist/ folders. They are skipped by default as build output, but a published npm package keeps its code there. Without the option nothing changes.build/ is read. The coverage column in the language table is generated from the scanner’s own tables.claude, gemini, copilot, aider, codex, opencode, q) launched from code or a CI step with a prompt is HIGH, and with its permission checks bypassed CRITICAL; base64, hex and compressed literals that decode to instructions for a model, or to a model host, are reported as encoded prompts and hidden endpoints — CRITICAL in a file that runs commands; a local model reached through OLLAMA_HOST or the Ollama client library, with no URL in the file, is an endpoint; Dart’s dart_openai and Gemini call forms anchor the rogue rule; the rogue rule counts a launch within 10 lines after the model call and 5 before; a model call is inside a loop only within the loop’s own block.--no-decode-literals in CI) decodes base64, base64url, hex and \xNN literals, one gzip/zlib/bz2/lzma layer and UTF-8 or UTF-16 text, scans the decoded text like a file, and rates the file CRITICAL when it hides AI-calling code and executes it. Images, fonts and archives are dropped by signature. The decoded contents are shown under the source in the agent report and on the demo source pages.InvokeAsync calls no longer trip it. The CRITICAL count appears in the summary and the tile text.Command::new and PHP static ::exec near an AI call, and an AI host named only in a comment, can over-report CRITICAL; the proximity window is 9 lines after the anchor, not 10; a file name containing HTML markup is unescaped in the agent-map tooltip; the build-files heading can differ from the PR comment when a manifest only adds download URLs; snapshot-report cosmetics; .DS_Store files under skipped folders count against that folder; deleting one demo sample leaves its paths in the folder fields until the mode changes.#! scripts are classified by interpreter. Symbolic links are skipped and reported. Comment metrics are line counts.$#array and POD, Ruby =begin blocks and regex literals, heredoc bodies in shell, Ruby and Perl, Go and JavaScript multi-line block comments, calls that own a callback, and equal-sized block swaps all count as their languages define them. A whitespace-only edit keeps the old side's own metrics. A run the database cannot record exits 1.'\\' literal keeps every function.fail-on-new without a baseline is an error; only the Action's own comment is updated; mode: churn works with the CI flags; without a base tree the churn modes degrade to a snapshot scan with a warning.model.predict and graph calls need AI context to count; imports are read from noise-stripped source; JavaScript SDKs are keyed by package; UTF-16 sources are scanned for secrets; legacy sk- and github_pat_ formats added and AWS's documented example keys are inert; the build-file alert looks inside build/; the egress gate sees every endpoint hit.--snapshot-date is honoured everywhere; value flags reject bad values with exit 2; outputs are UTF-8 on every platform; cross-origin requests to the local server are refused; the fetched demo survives a relaunch; Save dialogs open where they should.CODEDELTA_THREADS=1 restores serial; small scans stay serial automatically.--jobs, auto by default), byte-identical to serial: 7.0s to
2.75s on the same pair.class X : public Y, Java
extends/implements). Every class page shows Extends (linked
when the base was scanned) and Inherited by; in the class visualiser a base class links
with a solid blue line — textual mentions stay dashed.[warn] instead. Catches the classic wrong-folder pick before it wastes a scan.package.json
postinstall, a setup.py cmdclass — code that
runs on install) head the alert whatever their category; dependency manifests are a
quieter separate line. In the GUI’s Churn Results, the headless CLI’s
[build] lines, the agent report and the CI pull-request comment. A pair with
no build changes says so explicitly. See the availability grid in the Agent Scan chapter.--mode churn_agent / metrics_agent), keeping CLI/GUI parity.~/.codedelta/diagnostics.log. It only ever meant a per-function breakdown was
withheld for one file — totals, reports and CSV were always correct.// comments — a line comment ending in a backslash legally continues onto the next physical line; that continuation line was being counted as code. Fixed — the comment now ends only at a real, unspliced newline.
// see the macro below \
int this_line_is_part_of_the_comment = 1;
int real_code = 2;
The backslash at the end of the comment splices the next line onto it — so the middle line is comment, not code. Earlier releases counted it as a statement (overcount); this release reads it as the C standard does.
R"(...)" — a lone quote character inside a raw string literal jammed the parser's string state and could zero an entire file's LLOC. Fixed — raw literals are parsed to their closing delimiter and their contents are inert. Verified on fmt: its raw-string test file recovers 6 statements, with every other file in redis, curl, git and fmt bit-identical.
auto pattern = R"(don't "quote" me /* anywhere)";
int a = 1;   // earlier releases: a, b and everything below vanished
int b = 2;
The raw string's contents — the lone quotes, the apostrophe, the /* — are just characters. Earlier releases let an unbalanced quote flip the parser into “inside a string”, swallowing every statement after it: this three-statement file counted as zero LLOC. Now the literal is parsed to its closing delimiter and all three count.
OLD: /* Server global state */            NEW: /* Server global state (edited) */
     int hz = 10;                              int hz = 10;
Only the comment changed. Earlier releases recorded CHG_COM = 1 but reported the file Unchanged, so it never appeared in changed-file lists or the Code Browser. Now it lists as Changed, comment churn visible on its yellow COM chip — and code churn still zero.
codedelta X X, or the GUI’s AI/agent modes) gets the same page without the Changes tab — Open Code Browser in the GUI.--git mode, or a scanned directory inside a git work tree): AI provenance (lines authored in commits signed by an AI tool, with the tool named), age of destroyed code (how much churned code was under 30 days old) and a per-author People table in the overview.GEN_RULE column naming the rule that classified each file (npm lockfile, generator marker (@generated)…), and SARIF gains a codedelta/generated-churn note, so the GitHub Security tab can show which file’s churn was machine-produced rather than only a whole-scan subtotal.package-lock.json, minified bundles, protobuf/codegen output, files carrying generator markers like @generated or DO NOT EDIT) are classified deterministically and their churn is subtotalled in the report’s Coverage block (“Generated files” / “Generated churn” rows), the CSV GEN row, the console, and a GUI tile. Their numbers remain inside every churn total — nothing is excluded — so authored churn is always derivable — and is now a named metric: TRUE_CHURN = CRN_LLOC − CRN_GEN_LLOC, shown as its own report row, GUI tile, console line and CSV field (on the always-present GEN row). When nothing is generated, TRUE_CHURN equals CRN_LLOC.
| CHG_LLOC | DEL_LLOC | ADD_LLOC | CRN_LLOC | |
|---|---|---|---|---|
| Totals (headline) | 481 | 185 | 260 | 926 |
of which generated (GEN row) | 430 | 170 | 230 | 830 |
| authored = difference (TRUE_CHURN) | 51 | 15 | 30 | 96 |
Generated churn is not a fourth churn class: a generated file’s statements are classified CHG / DEL / ADD exactly like any other file’s, inside the corresponding headline columns, and the GEN row subtotals them per component (CHG/DEL/ADD_GEN_LLOC). The worked numbers above are the bundled churn demo: a one-line package.json bump whose regenerated lockfile accounts for 830 of the 926 churned statements.
package.json bump that regenerates a 10,000-line lockfile now reads as 1 line of authored work and 10,000 of generated churn, in the same report. Every classified file is named with the rule that matched.CLAUDE.md, .cursorrules), tier 2 agent workspaces and MCP configs, tier 3 rogue-agent residue (openclaw/ and kin) and committed agent credentials, each a named path with a live-vs-placeholder probe on credential files. Surfaced in the agent report, the AI-BOM, SARIF and the PR comment; an opt-in "fail_on_agent_artifacts" gate can block merges on tier-3 findings. Artifacts never change any file’s risk. See the Agent Infrastructure section below.mcp, fastmcp, @modelcontextprotocol), and Russian providers (Sber GigaChat, YandexGPT) with RU data-sovereignty flags — alongside the existing CN coverage..lua or .vim, not .txt documents) are now measured and churned as text lines: U_LOC (non-blank lines, comments included — hence not U_SLOC) with separate churn columns CHG/DEL/ADD/CRN_U_LOC. Reported in the churn report’s Coverage block, the CSV UNCLS row, the console and new GUI tiles — never mixed into SLOC/LLOC totals or REWORK. Map an extension to a parsed language with --ext.wc -l and cloc exactly. The raw size anchor for cross-checking.--exclude are now counted per directory in the report’s Coverage block, the CSV SKIPDIRS row and the console. Nothing is silently dropped..erl .hrl plus the Erlang-term family (.app .app.src .appup .rel .escript .xrl .yrl, Emakefile, rebar.config): % comments (string-, atom- and $char-aware) and EEP-64 triple-quoted strings, validated against the Erlang/OTP standard library..hh .hxx .inl .ipp .tpp now recognised (previously skipped), plus .mjs .cjs .pyi; new languages Make, CMake, DeviceTree, ASN.1 (incl. .mib), Protobuf and Dockerfile; and a data tier — JSON, YAML, TOML, INI/.properties. CodeDelta now measures 62 languages, 27 with real LLOC.Status X rows). Code files with no language-specific parser (usually source code, not .txt documents) are counted as “Unclassified text” in U_LOC (non-blank lines, comments included), with their line churn reported separately (CHG/DEL/ADD/CRN_U_LOC) — never entering the SLOC/LLOC totals or REWORK. Files excluded by skip directories (.git, node_modules, dist, build…) are counted per directory in the report’s Coverage block and the CSV SKIPDIRS row. No file is silently dropped.CodeDelta is a command-line source code metrics tool with a browser-based GUI. It compares two snapshots of a source project — an old version and a new version — and measures exactly what changed, how much, and how complex. It is a professional-grade source code analysis tool for macOS, Linux, and Windows.
If your source files are constantly being changed, the source base is not stable and is not ready for release. CodeDelta makes this visible. Every build, every sprint, every release — run CodeDelta and watch the churn numbers. A healthy codebase shows decreasing churn as a release approaches. A codebase that remains "hot and active" near release is a risk.
Software metrics should never be used to measure productivity. Our metrics are an indicator of where, and how much, coding activity is being conducted — and this can point to areas of code weakness, bugs, upgrades, rogue development, or something else entirely. They let managers see where the code is changing, and by how much.
This can be particularly important in mission-critical software, where code changes could be dangerous and must be strictly controlled and documented.
SLOC (Source Lines of Code) is a physical count — the number of non-empty, non-comment lines in the file. Two statements on one line = 1 SLOC.
LLOC (Logical Lines of Code) is a count of logical statements, excluding anything inside comments or string literals. Statements are delimited by semicolons in C-family languages, and by statement-ending newlines — with bracket, string and line-continuation awareness — in newline-terminated languages such as Python, JavaScript/TypeScript, Go, Ruby and Shell. One statement spread over three lines = 1 LLOC. This is invariant to formatting and is the preferred metric for measuring real code change.
int i=0; float j=0;  // This is 2 LLOC, 1 SLOC

cout << "Testing"
     << " Hello"
<< " there."; // This is 1 LLOC, 3 SLOCCodeDelta counts all source files recursively under the base directory, maps each file to a language by extension, and counts metrics per file. A file with no extension is classified by its first line when that is a #! interpreter line: #!/bin/sh or #!/usr/bin/env python3 make it Shell or Python, and Perl, Ruby and node scripts are recognised the same way. Symbolic links are never followed: each one is skipped and listed with the files not measured (the Coverage block in the report, Status X rows in the CSV). For comparisons, files are matched by relative path. A file present in the new project but not the old is Added (N). A file in the old but not the new is Deleted (D). A file present in both is either Changed (C) or Unchanged (U).
CodeDelta detects 62 languages by file extension. For 27 of them it computes real, formatting-invariant logical lines (LLOC); the remaining 28 are measured by physical lines, where LLOC equals SLOC. The table below is the complete, current list.
| Language | Extensions | Logical lines | Agent Scan |
|---|---|---|---|
| Ada | .ada .adb .ads | Real LLOC | Text level |
| ASP | .asp .aspx | SLOC only | Text level |
| Assembler | .asm .s | SLOC only | Text level |
| C / C++ | .c .h .cpp .hpp .cc .cxx .hh .hxx .inl .ipp .tpp | Real LLOC | Full |
| C# | .cs | Real LLOC | Full |
| COBOL | .cbl .cob .cobol .cpy | Real LLOC (sentences) | Text level |
| CSS | .css | SLOC only | Text level |
| Dart | .dart | Real LLOC | Full |
| DeviceTree | .dts .dtsi | Real LLOC | Text level |
| Dockerfile | Dockerfile | SLOC only | Endpoint level |
| Elixir | .ex .exs | SLOC only | Full |
| Erlang | .erl .hrl .app .app.src .appup .rel .escript .xrl .yrl | SLOC only | Text level |
| ASN.1 | .asn1 .asn .mib | SLOC only | Text level |
| Make / CMake | .mk .gmk .mak .kbuild .cmake, Makefile, CMakeLists.txt | SLOC only | Text level |
| Protobuf | .proto | Real LLOC | Text level |
| JSON / YAML / TOML / INI | .json .yaml .yml .toml .ini .cfg .properties | SLOC only | Text level (CI recipes — .github/workflows, .gitlab-ci.yml and similar: endpoint level) |
| Eiffel | .e | SLOC only | Text level |
| Fortran | .f .f90 .f95 .for | SLOC only | Text level |
| Go | .go | Real LLOC | Full |
| Groovy | .groovy .gvy .gradle | Real LLOC | Full |
| HTML | .html .htm .htp | SLOC only | Full |
| IDL | .idl | SLOC only | Text level |
| Astro | .astro | SLOC only | Full |
| Java | .java | Real LLOC | Full |
| JavaScript | .js .jsx | Real LLOC | Full |
| JCL | .jcl | SLOC only | Text level |
| JSP | .jsp | SLOC only | Text level |
| Julia | .jl | SLOC only | Full |
| Jupyter notebook | .ipynb | SLOC only | Full |
| Kotlin | .kt .kts | Real LLOC | Full |
| Lisp | .lisp .lsp .cl .scm .el | SLOC only | Text level |
| Lua | .lua | SLOC only | Full |
| MMP | .mmp | SLOC only | Text level |
| Objective-C | .m .mm | Real LLOC | Endpoint level |
| Oracle (PL/SQL) | .pls .pks .pkb | Real LLOC | Text level |
| Perl | .pl .pm | Real LLOC | Full |
| PHP | .php | Real LLOC | Full |
| PL/I | .pli .pl1 | Real LLOC | Text level |
| PowerBuilder | .srd .srf .srs .sru .srw | SLOC only | Text level |
| PowerShell | .ps1 .psm1 .psd1 | SLOC only | Full |
| Python | .py .pyw | Real LLOC | Full |
| R | .r | Real LLOC | Full |
| Ruby | .rb | Real LLOC | Full |
| Rust | .rs | Real LLOC | Full |
| Scala | .scala .sc | Real LLOC | Full |
| Shell | .sh .bash .zsh .csh .ash .bsh .tcsh .tsh | Real LLOC | Endpoint level (.bsh: shell rules only with a shell shebang; otherwise BeanShell, Java rules, full) |
| Smalltalk | .st | SLOC only | Text level |
| SQL | .sql | Real LLOC | Text level |
| Svelte | .svelte | SLOC only | Full |
| Swift | .swift | Real LLOC | Full |
| TypeScript | .ts .tsx .mts .cts | Real LLOC | Full |
| UCode | .uc | SLOC only | Text level |
| VBScript | .vbs | SLOC only | Text level |
| Visual Basic | .vb .bas .cls .frm | SLOC only | Text level |
| VHDL | .vhdl .vhd | Real LLOC | Text level |
| Windows Batch | .bat .cmd | SLOC only | Text level |
| Vue | .vue | SLOC only | Full |
| XML | .xml .xsd .xsl .xslt .wsml | SLOC only | Text level |
Agent Scan also reads files this table does not list: JavaScript (.mjs .cjs, full), SVG files (.svg, full — JavaScript rules on its script blocks), Shell (.ksh, endpoint level) and Jenkinsfile and CI recipes (endpoint level). The Agent Scan column is generated from the scanner's own language tables.
Need a language we don't cover yet — or full two-pass LLOC for one currently counted SLOC-only? Additional language support can be added on request as part of a support arrangement — contact us at codedelta.app to discuss your stack.
See the complete extension-to-language reference in section 03 (GUI Guide → Extension Overrides) for which file extensions auto-detect to which language. Custom mappings can be added without recompiling via the Extension Overrides field.
CodeDelta computes the source code metrics most commonly used in software-engineering analysis: SLOC, LLOC, comment counts, file counts, and per-language breakdowns. See the Metrics Reference table above for the full set.
| Code | Name | Description |
|---|---|---|
| LOC | Lines of Code | Total lines including whitespace and comments. A count of newlines. |
| SLOC | Source Lines of Code | Non-empty, non-comment lines. Physical line count of actual source. |
| LLOC | Logical Lines of Code | Semicolon count excluding those in comments or string literals. Statement count. |
| PLOC | Preprocessor Directive LOC | Lines beginning with # (#include, #define, #ifdef etc.). C/C++ and C# only. |
| U_LOC | Unclassified LOC | Non-blank lines in files of no recognised language. These are usually not plain-text documents but source code files (e.g. .lua, .vim) — counted as text lines into Total LOC and U_LOC and given their own UNCLS row, but kept out of the SLOC, LLOC and CRN totals (their churn appears on the file row only), because there is no language-specific parser, so comment stripping and true LLOC are not possible and they are measured as text lines. Comments count as content (no parser exists to strip them — which is why it is not U_SLOC); blank lines excluded. U_LOC and its churn (CHG_U_LOC / DEL_U_LOC / ADD_U_LOC / CRN_U_LOC, the CSV UNCLS row) are reported separately and never enter the SLOC/LLOC totals, churn totals or REWORK/REP_CHURN. Use --ext to map an extension to a supported language. |
| COM_LOC | Comment Lines of Code | Total comment lines = J_COM + C_COM + EOL_COM. |
| J_COM | Java-style comment lines | Lines inside /** ... */ docblock comments: a docblock spanning three lines contributes 3. The same split applies in JavaScript and TypeScript: a docblock is J_COM, a plain /* ... */ block is C_COM. |
| C_COM | C-style comment lines | Lines inside /* ... */ block comments, one per line spanned (also Ruby =begin/=end and Perl POD blocks). These are line counts, not counts of comments: one three-line comment is three comment lines. |
| EOL_COM | End-of-line comment lines | Lines carrying a // (or #, --, ;) comment to end of line. |
| BYTES | File Size | File size in bytes from the filesystem. |
| NFILE | Number of Files | Total number of source files in the project. |
| Code | Name | Description |
|---|---|---|
| CHG_SLOC | Changed SLOC | Source lines that exist in both files but differ. |
| DEL_SLOC | Deleted SLOC | Source lines in the old file not present in the new. |
| ADD_SLOC | Added SLOC | Source lines in the new file not present in the old. |
| CRN_SLOC | Churn SLOC | CHG_SLOC + DEL_SLOC + ADD_SLOC. Total change volume. |
| MOV_SLOC | Moved SLOC | Physical lines occupied by moved statements (see MOV_LLOC). A move is not churn: these lines are taken out of DEL_SLOC and ADD_SLOC, so CRN_SLOC = CHG_SLOC + DEL_SLOC + ADD_SLOC excludes them and MOV_SLOC is reported alongside it. |
| CHG_LLOC | Changed LLOC | Logical lines that exist in both but differ. The primary metric. |
| DEL_LLOC | Deleted LLOC | Logical lines in old not in new. |
| ADD_LLOC | Added LLOC | Logical lines in new not in old. |
| CRN_LLOC | Churn LLOC | CHG_LLOC + DEL_LLOC + ADD_LLOC. |
| MOV_LLOC | Moved statements | A statement deleted at one position whose identical text was added at another position in the same file — recorded once as a move, not as a delete plus an add. A move is not churn: CRN_LLOC = CHG_LLOC + DEL_LLOC + ADD_LLOC, and MOV_LLOC is reported alongside it, never inside it (ruled 2 Sep 2026). Moving code is reorganisation — human maintenance behaviour. |
| CHM_LLOC | Changed and moved | Statements edited inside a block that moved. Edits trump moves: such a statement is counted in CHG_LLOC (it is churn), never in MOV_LLOC, and reported here so both facts stay visible. The Code Browser paints it red with the navy move edge. Recognised only inside a moved block (at least two moved neighbours); a lone statement that moved and was edited leaves the same trace as a delete plus an unrelated add and is not recognised. |
| REP_CHURN | Replacement Churn | (ADD_LLOC + DEL_LLOC) / CRN_LLOC, bounded 0–1. The share of churn that was insertion and removal rather than in-place editing. |
| REWORK | Rework share | CHG_LLOC / CRN_LLOC — the complement of REP_CHURN and the readable form for comparisons: the share of all change activity spent editing statements that already existed. Hand-maintained established projects measure around 17% (1 statement in 6); intensively agent-assisted code around 0.2% (1 in 500). A low value alone is not evidence of AI — rapid greenfield growth is also low. Strongest read is against a project’s own history. |
| REWRITE_LLOC | Rewritten in place | Co-located DEL+ADD statement pairs inside one replace region that were rewritten beyond recognition — a block torn out and rewritten where it stood. Each pair consumes one DEL_LLOC and one ADD_LLOC. |
| PDEL_LLOC | Pure deletions | DEL_LLOC − REWRITE_LLOC: statements removed with nothing put in their place. |
| PADD_LLOC | Pure additions | ADD_LLOC − REWRITE_LLOC: new statements that replaced nothing (growth). |
REWORK vs REWRITE, in one breath: REWORK measures editing — statements modified in place that recognisably survive; REWRITE counts replacement-in-place — statements torn out with something different written where they stood. Editing a novel: REWORK is touching up sentences, REWRITE is redoing the paragraph. REWORK is a ratio of total churn; REWRITE is a count of pairs.
REP_CHURN, REWORK, PURE_DEL and PURE_ADD are pure arithmetic over the churn counters. REWRITE is the one metric that rests on a judgement, so here is exactly how it is made. The differ aligns the two versions’ logical statements (Myers shortest edit script) and finds replace regions — gaps where old statements were removed AND new statements inserted at the same location. Inside each region, deleted and inserted statements are paired positionally (1st with 1st, up to the smaller count); each pair takes a character-overlap similarity test (integer Jaccard, threshold 30%). At or above threshold the pair is CHG (edited in place); below it, REWRITE (torn out, different content written in its place). Unpaired leftovers are pure deletions or pure additions.
Verify it yourself on any scan: REWRITE + PURE_DEL must equal DEL_LLOC, and REWRITE + PURE_ADD must equal ADD_LLOC — these identities hold on every run or the implementation is broken. The four composition figures sum to CRN_LLOC only when REWRITE is counted twice (CHG + 2×REWRITE + pure deletions + pure additions = CRN_LLOC) — each pair is one tile but two statements of churn. And REWORK + REP_CHURN = 1 exactly: they are complements (tiles round for display). Known limits, stated before you find them: the 30% threshold is a calibrated dial (statements near the boundary can flip); positional pairing can mis-pair inside a heavily rearranged block (aggregates barely move); moved-and-tweaked code counts as pure del + pure add, not REWRITE; and mechanical reformat sweeps inflate CHG. These metrics characterise a development process over a period — never a verdict on an individual change or author.
Measured figures from a 1,400-scan campaign across the largest public codebases (2010–2026), so you can plan before scanning a big estate. The rule of thumb for git mode (codedelta --git a..b): peak disk ≈ repository clone + two extracted snapshot trees + output files — the engine extracts both versions to a temporary folder for the scan and deletes them afterwards. For two-directory mode the trees are already on disk, so the cost is outputs only.
Verified examples: curl (six-month scan) — clone 0.3 GB, peak under 1 GB, seconds to run. Linux kernel (one-year window, ~2 million logical statements of churn) — clone ~3 GB, peak ~7 GB. WebKit (half-year window, ~4 million statements of churn) — clone ~12 GB, peak ~17–20 GB. A full half-year WebKit scan completes on a consumer laptop.
Two further sizes to know: the results database grows with each recorded run (a few MB per large scan — tens of KB for typical projects), and the Code Browser embeds the full source of every changed file (and, within a 25 MB budget, of unchanged files too). Measured guidance: roughly 26 KB of report per changed file — about 80 MB / 5 seconds to open at 3,000 changed files, 210 MB / 19 seconds at 8,000. Past ~1.5 million display lines the generator automatically switches to embedding changed regions with context instead of whole files (each report states this in its story lines), which keeps very large scans openable; use the main report (much smaller) for a first look either way. Machines with 256 GB disks comfortably run any normal project scan; the multi-gigabyte figures above apply only to whole-history scans of the world’s largest repositories.
| Code | Name | Description |
|---|---|---|
| CHG_FILE | Changed Files | Number of files present in both snapshots that changed. |
| DEL_FILE | Deleted Files | Number of files in the old snapshot not in the new. |
| ADD_FILE | Added Files | Number of files in the new snapshot not in the old. |
| CRN_FILE | Churn Files | CHG_FILE + DEL_FILE + ADD_FILE. |
Large codebases carry data wearing code’s syntax: generated
instruction tables, firmware images and lookup tables committed as single
initializer statements (NVIDIA’s open GPU modules embed firmware as C arrays
up to 3MB per statement — 28% of that tree’s source lines are data).
Data metrics separate this from engineering change. A data
statement is one whose initializer body holds 16 or more top-level
elements (comma-separated values; a nested {…} or a call’s
argument list counts as one element). Churned statements partition exactly:
CRN_LLOC = code + data.
| Code | Name | Description |
|---|---|---|
| DATA_CHG / DATA_DEL / DATA_ADD | Data-statement churn | How many of the churned statements (already counted in CHG/DEL/ADD_LLOC) are data initializers. Subtract from the headline numbers for working-code churn and working-code REWORK — the engineering signal with table refreshes removed. |
| ELEM_CHG / ELEM_DEL / ELEM_ADD | Element churn | Changed / deleted / added elements inside the data statements — “37 of 1,647 table rows updated”. Whitespace-invariant: reformatting a table produces zero element churn. |
| DATA_LLOC | Data statements | Whole-tree composition: how many of the codebase’s statements are data initializers. |
| DATA_SLOC | Data lines | Content lines inside those initializer bodies — the share of your SLOC that is data, shown as a percentage in the terminal summary. |
| DATA_ELEMS | Data elements | Total elements the data statements hold. |
Coverage: C, C++, C#, Java, Objective-C, JavaScript and TypeScript (brace
initializers), plus Erlang collection literals ([ ],
{ }, #{ }, << >>).
The code/data churn partition (DATA_CHG…) applies to the
semicolon languages only — Erlang reports composition and element churn.
These metrics never alter CHG/DEL/ADD_LLOC, CRN or REWORK; they appear as
additional CSV columns, terminal lines and an HTML report row, and are not
yet stored in the trend database.
| Status | Meaning |
|---|---|
| C | Changed — file exists in both snapshots and content differs |
| N | New — file exists only in the new snapshot (added) |
| D | Deleted — file exists only in the old snapshot (removed) |
| U | Unchanged — file exists in both with no code, statement or comment churn: byte-identical, or a whitespace-only edit (indentation, blank lines, trailing spaces) |
| O | Old — CSV only: old metrics row for a changed file |
| X | Diff — CSV only: arithmetic difference row for a changed file |
LLOC is computed in two passes. Pass 1 strips all comments and string literals and identifies statement boundaries — semicolons in C-family languages, or statement-ending newlines (respecting brackets, strings and line continuations) in newline-terminated languages such as Python, JavaScript/TypeScript, Go, Ruby and Shell. Braces never count: a line holding only { or } is not a logical line in any language, and a closing brace neither ends nor starts a statement (ruled 2 Sep 2026). Pass 2 identifies function boundaries using brace counting and signature detection, allowing CodeDelta to attribute LLOC to specific functions. The two-pass approach resolves the common ambiguity where a single logical statement spans multiple physical lines.
When LLOC diverges significantly from SLOC (ratio > 3.0 or < 0.3), CodeDelta flags the file with an LLOC warning in the report. This usually indicates unusual formatting — very long chained expressions, or highly condensed single-line code.
Most churn tools apply a single generic rule to every language — count physical lines, or count semicolons. That is quick to build but wrong for any language whose statements do not end in a semicolon. Python, Go, Ruby, Shell and modern (semicolon-free) JavaScript all break a naïve counter: it either inflates the count (treating one statement spread over several lines as many) or collapses it (merging a whole function body into a single logical line). Both corrupt the churn figure.
CodeDelta instead ships a dedicated logical-line parser for each language
family, encoding that language's real rules for where a statement begins and
ends. The payoff is directly observable: the same logical change lands at a
near-identical Replacement Churn in every language — the bundled multi-language demo
(the same Account class in seven languages) demonstrates this side by side.
| Language | How a logical line is determined | Notable cases handled |
|---|---|---|
| C, C++, C#, Java, Objective-C, PL/I, PHP, SQL, Perl, Rust | Semicolon-terminated statements | Comments and string literals stripped first; PHP # comments; SQL/Perl --; PL/I /* */ |
| Python | A newline ends a logical line at bracket depth 0; () [] {} and a trailing \ continue it; ; splits |
Triple-quoted strings, # comments, multiple statements per physical line |
| Dart | Statements are strictly ;-terminated (no ASI) — the C-family semicolon rule, with scope braces discarded and map/set literals kept |
NESTED /* */ comments, /// doc comments, triple-quoted multiline strings, raw r'...' strings, ${} interpolation |
| JavaScript / TypeScript | Automatic Semicolon Insertion — a newline ends a statement unless the line is incomplete (trailing or leading operator, open bracket); both ; and ASI are honoured, inside function bodies too |
Template literals, regex literals, method chains, and block {} vs object-literal {} disambiguation |
| Go, Kotlin, Swift, Scala, Groovy | ASI rule — a newline ends a statement when the last token is value-ending (identifier, literal, ) ] }, ++/--) and not inside ( or [. Kotlin, Swift, Scala and Groovy are semicolon-optional and reuse this counter |
Composite literals vs blocks; back-tick raw strings spanning lines; statements inside function bodies |
| Ruby | A newline ends a statement unless continued by a trailing operator, a leading . (method chain), a \, or an open bracket; ; splits |
Here-documents, #{} interpolation, block parameters |
| Shell | A newline, ; or & ends a command unless continued by \, |, && or ||; pipelines and &&/|| lists are one logical line |
Here-documents, $( ) and ${ } expansions, word-boundary # comments, function and group bodies |
| R | Newline-terminated (Go-ASI shape) with # comments; { } code blocks count statements inside; not inside ( or [ |
<- assignment and %>% pipe continuation, identifiers containing . |
| COBOL | Sentence counting — a logical line is a COBOL sentence,
ended by a separator period: a . followed by a space or end of line,
outside string literals (the ISO/IEC 1989 rule). Note what this means: an
IF … END-IF. sentence spanning several physical lines is
one logical line, and several statements before a single period
also count once — LLOC counts sentences, not verbs. Decimal
literals (3.14) and picture clauses (PIC 999.99) never
split, because their period is not followed by a space |
Fixed format (column-7 *// comments) and free format
(*>) both recognised; sequence-number columns 1–6 and
columns 73+ are ignored, so wholesale renumbering registers zero churn;
reformatting a sentence across different line layouts registers zero LLOC churn |
| JCL, PowerShell | Counted at SLOC granularity — LLOC = SLOC | JCL //* comment lines; PowerShell # line and
<# … #> block comments, # inside strings ignored |
| Ada, VHDL, Assembly, Fortran, VB, CSS, HTML, … | Counted at SLOC granularity — LLOC = SLOC (no separate logical-line lexer) | Per-language comment styles still recognised (--, ;, ', //) |
This is why CHG_LLOC is the headline metric: it measures real statement-level
change, invariant to formatting, and it is comparable across a polyglot codebase. Where a
language has no dedicated lexer, CodeDelta falls back to LLOC = SLOC rather than
guessing — and any of those can be promoted to full logical-line parsing on request (see
Supported Languages above).
Start the GUI server from the Terminal:
python3 /Applications/CodeDelta/codedelta_server.pyThen open http://localhost:7654 in your browser. The GUI runs entirely locally — no internet connection required, no data leaves your machine.
The Run Analysis tab is split into two columns. Pick whichever fits the work you're doing:
| Mode | What it does |
|---|---|
| Code Churn | Standard SLOC/LLOC churn metrics between two snapshots (Old and New). The classic CodeDelta function. |
| Code Churn + AI Audit | Churn metrics (Old vs New) PLUS AI Audit on the new snapshot. Single pass, three reports. |
| Project Metrics | Single project, no comparison and no AI — SLOC/LLOC/comment/file counts on one folder. The fastest mode; use it to confirm all code parsed cleanly. Columns are filterable with Metric Sets. |
| Mode | What it does |
|---|---|
| AI Audit | Runs BOTH AI Code Scan and Agent Scan, producing TWO reports side by side. Use this when you want a complete AI assessment. |
| AI Agent Tracer | Reads the session logs your coding agents write (Claude Code, Codex, Cursor, Copilot CLI, Gemini CLI, Antigravity) and reports what they did — see section 08. Leave the folder empty for this machine’s logs. New in 2.2.0; the standalone AI Code Scan button it replaces still runs inside AI Audit and Churn + AI Audit, and the CLI keeps --mode ai. |
| AI Agent Scan | Just the AIS (Agent Initiation Signature) analysis. Produces codedelta_agent_scan.html for security review. |
Every single-project code mode (AI Audit, AI Agent Scan, Metrics + Agent Scan) also runs the engine as a snapshot, so each one shows the same project-metrics tiles — you can always confirm how much code was parsed, whichever scan you ran. The Code Browser has a light/dark toggle in its top-right corner, defaulting to light.
| Field | Description |
|---|---|
| Old Project | Path to the previous version of the source code. |
| New Project | Path to the current version of the source code. |
| Exclude Directories | Comma-separated directory names to skip (e.g. vendor,tests,node_modules). New in v1.4.0. |
| Extension Overrides | Map non-standard extensions to existing language parsers. Comma-separated ext=lang pairs (e.g. h2=cpp,inc=php,ksh=sh). New in v1.4.2. |
| HTML Report | Output path for the HTML report. |
| Database | Path to the SQLite database file. Accumulates all runs for trend analysis. Defaults: ~/Library/Application Support/CodeDelta/codedelta.db on macOS, ~/.local/share/CodeDelta/codedelta.db on Linux, %APPDATA%\CodeDelta\codedelta.db on Windows. Survives reinstalls. |
| Project Name | A label for this project, shown in reports and the History tab. |
| Old Label | A label for the old snapshot (e.g. v1.0, sprint-13). |
| New Label | A label for the new snapshot (e.g. v1.1, sprint-14). |
| Snapshot Date | The date the source was extracted (YYYY-MM-DD). Stored in the DB and shown in reports. New in v1.4.0. |
| Metric Set | Optional: select a named metric set to filter which columns appear in the report and CSV. New in v1.4.0. |
A Metric Set is a named subset of metric columns. When active, only the selected metrics appear in the HTML report table and CSV output. This is useful for management reports that only need CHG_LLOC and ADD_LLOC, without the full detail of every metric.
To create a Metric Set:
The set is saved in the database and appears in the dropdown for future runs. To edit an existing set, click Edit beside it — it loads into the editor. To delete, click Delete.
To run without a metric set filter, leave the dropdown on — All metrics (no filter) —.
Available metric codes for sets: LOC, SLOC, LLOC, PLOC, COM_LOC, J_COM, C_COM, EOL_COM, Bytes, CHG_SLOC, DEL_SLOC, ADD_SLOC, CRN_SLOC, CHG_LLOC, DEL_LLOC, ADD_LLOC, CRN_LLOC, REP_CHURN, REWORK, REWRITE_LLOC, PDEL_LLOC, PADD_LLOC, CHG_COM, DEL_COM, ADD_COM, CRN_COM, CHG_FILE, DEL_FILE, ADD_FILE, CRN_FILE
Enter a comma-separated list of directory names to exclude from both the old and new scans. For example: vendor,tests,third_party,generated. The names are matched against each path component — you do not need to provide full paths.
Built-in excluded directories (always skipped): .git, .svn, .hg, node_modules, __pycache__, vendor, dist, build, Debug, Release
Symbolic links are never followed, whether they point at a file or a directory: each is skipped and counted among the files not measured. The build-file change alert in Threat Detection looks inside build/ even though the churn scan skips it.
Excluded directories are stored in the database run record and shown in the report header, so you always know what was and wasn't included in a historical run.
Some organizations use non-standard file extensions — for example .h2 for C++ headers, .inc for PHP include files, or .ksh for shell scripts. By default CodeDelta ignores files with unrecognized extensions. Extension overrides let you map any extension to an existing language parser without recompiling.
Enter a comma-separated list of ext=lang pairs in the Extension Overrides field:
h2=cpp,inc=php,ksh=shThe target language can be any known extension (cpp, py, java, sh etc.) or a language name. Unknown target languages are silently ignored. The override takes effect before directory scanning, so all file matching uses the updated map.
| Language | Auto-detected extensions |
|---|---|
| C / C++ | c h cpp hpp cc cxx |
| C# | cs |
| Java | java |
| JavaScript / TypeScript | js jsx ts tsx |
| Python | py pyw |
| PHP | php |
| Ruby | rb |
| Perl | pl pm |
| Shell | sh ash bash bsh csh tcsh tsh zsh |
| SQL | sql |
| SQL (Oracle/PL-SQL) | pls pks pkb |
| Visual Basic | vb bas cls frm |
| VBScript | vbs |
| Windows Batch | bat cmd |
| Ada | ada adb ads |
| COBOL | cbl cob cobol cpy |
| JCL | jcl |
| PL/I | pli pl1 |
| Objective-C | m mm |
| Scala | scala sc |
| Groovy | groovy gvy gradle |
| PowerShell | ps1 psm1 psd1 |
| Fortran | f f90 f95 for |
| Assembly | asm s |
| VHDL | vhd vhdl |
| HTML | html htm htp |
| ASP | asp aspx |
| JSP | jsp |
| CSS | css |
| XML | xml xsd xsl xslt wsml |
| IDL | idl |
| Symbian MMP | mmp |
| PowerBuilder | srd srf srs sru srw |
| Dart | dart |
| Elixir | ex exs |
| Erlang | erl hrl app appup rel escript xrl yrl |
| Julia | jl |
| Jupyter notebook | ipynb |
| Vue / Svelte / Astro | vue svelte astro |
| Lua | lua |
| DeviceTree | dts dtsi |
| ASN.1 / MIB | asn1 asn mib |
| Make / CMake / Dockerfile | mk gmk mak kbuild cmake + well-known filenames |
| Protobuf | proto |
| Data formats | json yaml yml toml ini cfg properties |
| Smalltalk | st |
| Eiffel | e |
| Lisp | lisp lsp cl scm el |
| μCode | uc |
| Text | txt tsv cvs install readme |
When mapping a custom extension via the override field, the target side of the ext=lang pair can be any of the codes above (e.g. cpp, py, java, sh, f90). Both the alias and the destination must already be known to CodeDelta — unknown destinations are silently ignored.
After a run, results appear as coloured tiles in four groups:
Shows all previous runs stored in the selected database. Columns include run date, snapshot date, project, old/new labels, file counts, SLOC/LLOC totals, and churn metrics. Click any row to open its HTML report.
Charts CRN_SLOC and CRN_LLOC over time for a selected project. A declining trend indicates the codebase stabilising toward release. An increasing trend near a release deadline is a quality risk.
Every scan generates a Code Browser (*_diff.html, beside the report) — a
self-contained page that reads the scanned code. Five tabs stay at the top of every screen:
Changes (comparisons only), Overview, Files,
Classes and Visualiser; the browser’s Back button retraces
your steps and every screen carries a breadcrumb. For a churn comparison the Changes tab is the
side-by-side diff — the place to read the change and the evidence behind every
number the scan reported. Its organising rule: every counter is a claim you can click, walk,
and cite. A single-project scan has no Changes tab: the same page is the project’s code
browser — structure, classes, files and their relationships.
The page opens on the Overview. For a comparison it begins with the scan overview: one plain-language sentence of totals, then the changed files ranked by how much happened in them, each with a one-line story (“Mostly new content — 564 lines added … 15 statements moved within the file”); click any file to open it in the diff. Below that (and first, for a single-project scan) comes the project’s structure: languages, top-level directories with their include links, every class (language, files, methods, who it talks to), every file (filter, sort, churn chips for changed files) and the strongest relationships — directory include links and class “talks-to” pairs.
Files is the directory tree (changed files wear C/D/A chips and open in the diff; directories show how many of their files changed) with a reader for any file: its classes, its functions in line order, what it includes and who includes it, and its source with line numbers. Classes lists every class or namespace container found (C++, C# and Java) — files, methods with file and line, the classes its code mentions (a textual name match, a pointer for review, not a resolved call graph, each mention cited by file and line) and the classes that mention it. Visualiser draws the include map (directories) and the class ego view in 3D. Source is embedded for unchanged files up to a 25 MB budget; past it, files show structure only and the page says how many.
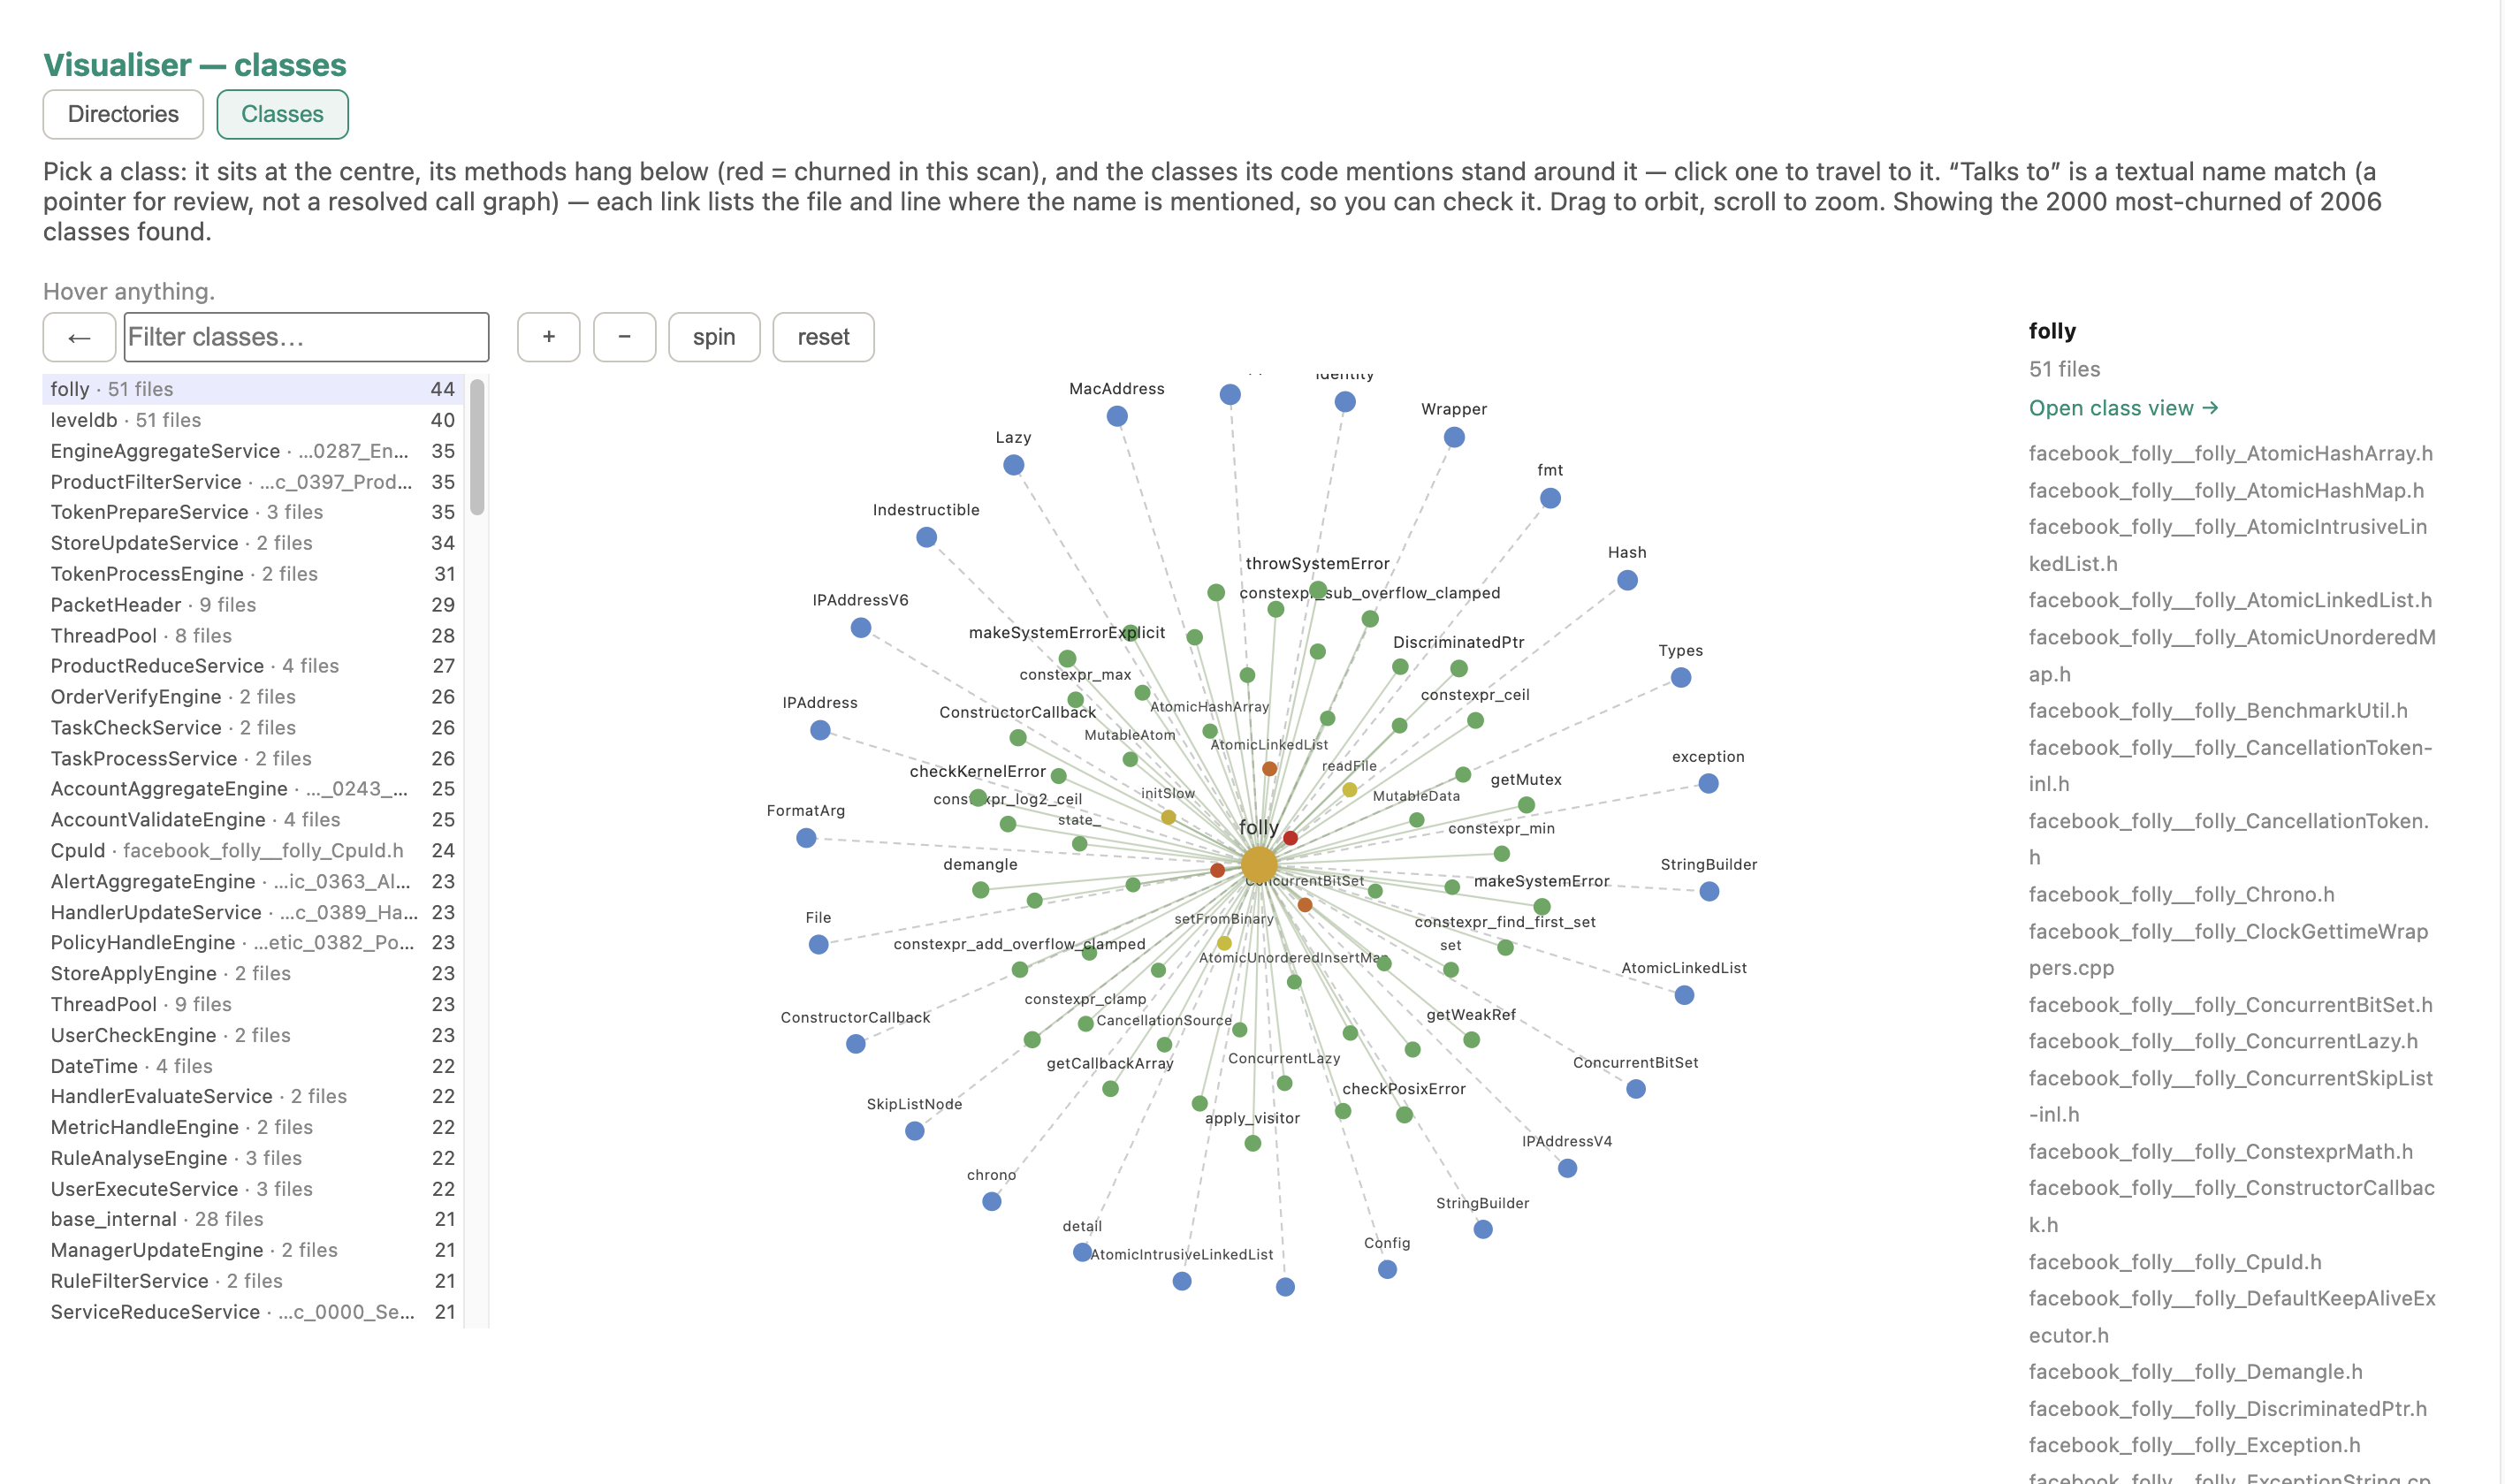
folly, across 51 files), its methods round it — red where this scan churned them — and the classes its code mentions as satellites; every link cites the file and line of the mention. A pointer for review, not a resolved call graph.Comparisons only: the changed-file list on the left (sort by path, churn or moves; MOV filter; per-function counts), the file’s diff on the right.
Under the toolbar, a story line describes the file in words before any code. Colours follow the CodeDelta convention: red changed, blue deleted, green added, yellow comment-only churn, violet moved. On changed rows the exact tokens that differ are shaded; when a pair of lines is mostly different the whole line is shaded instead — that pair is effectively a removal and an addition that met at the same diff position, not an edit. Alignment gaps (a line that exists on only one side) show as hatched space.
Click any counter in the toolbar — CHG, DEL, ADD, MOV, XMOV, AI% — and the stepper (◀ ▶) walks exactly the rows that counter counts, e.g. “changed 3/106”. The Ledger button decomposes every counter into its rows — each entry jumps to its line, and “Copy as text” exports the lot with citable links. Where the displayed rows and the engine’s counted total differ (comment-adjacent alignment), the ledger shows both numbers side by side.
A moved statement (identical text deleted at one position, added at another, at least 12 characters and unique on both sides) paints violet at both ends, each end carrying a chip naming its counterpart (“→ L163”); click the chip to jump. The stepper walks moves as pairs (“move 4/9”), and the ☰ button lists every move in the file. Cross-file moves (dashed chips, XMOV counter) are statements that left for, or arrived from, another file — clicking follows across files. XMOV is a reporting overlay: the churn counters still count the deletion and the addition, so per-file numbers never depend on unrelated files.
When the scan can see git history — always in --git mode, or when a
scanned directory lies inside a git work tree — three further overlays appear.
AI provenance: lines authored in commits signed by an AI tool (Claude
Code, Copilot, Cursor, Aider and others) carry a teal mark on the line number and the code
edge; the AI% counter walks them, and hovering names the tool. Age of destroyed
code: the story line reports what share of the churned code was under 30 days old
— rework of recent work. People: the overview lists, per author,
how many lines of their code were churned away and how many of the new lines they wrote.
All three are reporting overlays; none of them changes a churn counter, and none appears
when scanning plain directories with no git history.
The minimap strip on the right shows every change in the file as a coloured mark
— click it to jump. Search in file marks its matches in the landed
row (Enter / Shift+Enter cycle). Double-click any line number to copy a link that reopens
the report at exactly that line — the address bar always reflects where you are, so
a finding can be pasted into a ticket. Keyboard: j/k step the
selected counter, m moves, a AI-signed lines, f
the file filter, / search; the ? button holds the full
legend. Large, sparse files (changelogs) open in Changes Only automatically, with
the collapse stated in the story line; the … separators expand in place. The file
list sorts by path, churn, or moves, filters by name, and the bar between the list and
the code drags to resize (double-click resets).
codedelta <old-dir> <new-dir> [options]
codedelta --git <oldref>..<newref> [options] # run inside your git repoWith --git there is no need to check out two copies of the project —
CodeDelta extracts both committed snapshots itself (via git archive, so the
state of your working tree never affects the result), compares them, and removes the
temporary trees afterwards. Refs can be tags, branches, or hashes:
--git v1.7..v1.8, --git HEAD~10..HEAD, or a bare
--git v1.7 meaning v1.7 against HEAD. Labels, the project name,
and the snapshot date default to the refs and the new ref's commit date — useful for
backfilling a longitudinal database from historical releases. Requires git
and tar on the PATH (both standard on macOS, Linux, and Windows 10+).
New in v1.8.2.
| Flag | Description |
|---|---|
--git <a>..<b> | Compare two committed git refs instead of two directories (see Git Mode above). New in v1.8.2. |
-o, --output <file> | HTML report output path (default: codedelta_report.html) |
--csv <file> | Also write a CSV report |
--xml <file> | Also write a structured XML report. Contains all metrics including PLOC. |
-d, --db <file> | SQLite database path (default: codedelta.db) |
--project <name> | Project name for the database and report |
--old-label <label> | Label for the old snapshot |
--new-label <label> | Label for the new snapshot |
--note <text> | Freeform note stored in the database run record |
--exclude <dirs> | Comma-separated directory names to skip (e.g. vendor,tests). New in v1.4.0. |
--snapshot-date <date> | Date source was extracted, YYYY-MM-DD. New in v1.4.0. |
--metric-set <codes> | Comma-separated metric codes to include in report/CSV. New in v1.4.0. |
--ext <pairs> | Map non-standard extensions to language parsers. Comma-separated ext=lang pairs, e.g. h2=cpp,inc=php. New in v1.4.2. |
--threshold-churn <n> | Exit with code 2 if CRN_LLOC exceeds n (for CI gates) |
-v, --verbose | Verbose output |
-q, --quiet | Suppress all stdout output |
-V, --version | Print version and release notes |
-h, --help | Print usage |
| Code | Meaning |
|---|---|
| 0 | Success |
| 1 | Generic failure (I/O error, missing directory, report write failed) |
| 2 | Invalid arguments |
| 3 | Churn threshold exceeded (--threshold-churn) — deliberate build-fail signal |
| 4 | No valid license found |
The CSV has one header row and one or more data rows per file. For changed files, three rows are output:
The CSV output format is compatible with standard spreadsheet tools. Unchanged and deleted files have one row only. The file ends with a TOTAL row and a NFILE summary row.
If a Metric Set is active via --metric-set, only the specified columns appear in the CSV header and data rows.
#!/bin/bash
codedelta /builds/project-v1.1 /builds/project-v1.2 \
  --project "MyApp" \
  --old-label "v1.1" \
  --new-label "v1.2" \
  --snapshot-date "$(date +%Y-%m-%d)" \
  --exclude "vendor,node_modules,generated" \
  --db /var/lib/codedelta/myapp.db \
  -o /var/www/reports/myapp-latest.html \
  --csv /var/www/reports/myapp-latest.csv \
  --threshold-churn 5000 \
  -q

if [ $? -eq 2 ]; then
  echo "ALERT: churn exceeds threshold — build is hot"
  exit 1
fiFor the security reader — the auditor, the AppSec engineer — CodeDelta’s scans are five threat-detection instruments in one pass. Everything dangerous that hides in a repository — an implant, a rogue agent, a leaked key — leaves hard, checkable evidence; each instrument looks for one kind of it and reports file-and-line facts, never verdicts of malice.
+ new-source / − old-source), because one edited download
URL redirects the build’s supply chain.exec or a shell — how prompt injection becomes code execution), plus the
artifacts agents leave behind, down to tier-3 residue. The same layer detects
committed credentials with a fixed table of documented key formats (AWS,
GitHub, OpenAI, Anthropic, Google, Hugging Face, Slack, Stripe live keys, PEM private keys)
— no entropy scoring: a string matches a vendor’s published format or it is not
flagged. Findings are redacted everywhere, including the report’s embedded source
viewer, because reports travel. Rotate the key first, then remove it: removal alone leaves
it valid in git history.--bom
emits the record (native JSON or CycloneDX): every provider, jurisdiction, sovereignty risk,
with files named.--fail-on-new blocks pull requests
that add findings against your baseline; --gate fails builds on policy. The rogue pattern and denied
jurisdictions gate by default; three further switches ship off so a test
fixture can never break a build uninvited — enable them in your
--gate-policy file:{
"fail_on_committed_credentials": true,
"fail_on_new_install_hook": true,
"fail_on_new_fetcher": true
}“New” is computed against the old side of the diff: a project that has always
fetched does not fail — only the diff where fetching started does. All of it
runs in one scan (GUI: Churn + Agent Scan; headless:
--mode churn_agent --bom --gate --fail-on-new) and inside your own
infrastructure.
One line runs all five layers:
./codedelta-gui scan new/ old/ --mode churn_agent --bom --gate --gate-policy policy.json --fail-on-newWhat comes back on the terminal: [build] ALERT: with per-file status lines,
** install hook ** / ** fetches remote content at build time **
markers and the +/− URL delta lines beneath a changed fetcher;
[agent] tier counts, artifact and ALERT: N committed credential(s)
lines (values redacted), followed by the gate-off notice naming the exact policy key to flip;
[bom] summary; and [gate] pass or an itemised violation list.
Exit code 0 clean, 3 on a --fail-on-new regression or a gate
failure — the exit code is what makes CI block the merge. The reports — the agent
HTML with the red boxes, the AI-BOM JSON — are written alongside for the humans.
The standalone threat-detection mini guide covers each layer in depth, with the report screenshots and the full policy reference.
Everything above drives the C++ engine directly. The batch CLI runs that
same engine and adds the rest of the product headlessly — the AI scans, the pass/fail
gates, SARIF, the AI-BOM and the longitudinal database. Two subcommands:
scan and trend. Note the argument order:
the engine takes old new; the batch CLI takes new old.
codedelta-gui scan <new_dir> [old_dir] [options]   # from the installed bundle
codedelta-gui trend <db> [--out FILE] [--project NAME] [--limit N]
The full scan --help, verbatim:
CodeDelta batch scan (headless — no GUI)

Usage:
  codedelta-gui scan <new_dir> [old_dir] [options]

  <new_dir>   directory to scan (required)
  [old_dir]   previous version, for churn/diff (optional; omit for snapshot)

Modes (--mode M — the same choices the GUI offers):
  churn         churn only                 (default when two dirs are given)
  churn_agent   churn + Agent Scan, no ML  (the GitHub Action's default)
  agent         Agent Scan only
  ai            AI code audit only
  ai_audit      AI audit + Agent Scan on one dir (default when old_dir omitted)
  both          everything: churn + AI audit + Agent Scan

Output (default: all formats):
  --out-dir DIR     where to write outputs        (default: current dir)
  --bom FILE        write an AI Bill of Materials (providers, jurisdictions,
                    risk/cost/sovereignty flags) for the Agent Scan
  --bom-format F    native (default) or cyclonedx (CycloneDX 1.6)
  --gate            fail (exit 3) on the default policy: egress to a non-allied
                    jurisdiction (CN/RU/KP/IR) or the rogue exec-on-model pattern
  --gate-policy F   fail using a custom JSON policy (deny_jurisdictions,
                    allow_providers, deny_flags, max_risk,
                    fail_on_agent_artifacts — off by default; true fails on
                    tier-3 agent artifacts: rogue residue / agent credentials)
  --html            HTML reports (churn + audit + agent)
  --csv             raw CSV (engine metrics + audit + agent per-file)
  --json            raw JSON (audit + agent)
  --xml             engine EPM-compatible XML
  --db PATH         longitudinal SQLite DB (default: <out-dir>/<name>_run.db)
  (if none of --html/--csv/--json/--xml given, ALL are produced)

Labels / trending:
  --project NAME    --note TEXT   --old-label TEXT   --new-label TEXT
  --threshold N     AI sensitivity 0-100            (default 50)

Baselining (suppress known findings; alert only on new ones):
  --write-baseline FILE accept the current flagged files; snapshot to FILE
  --baseline FILE       compare this scan to FILE; report only what got worse
  --fail-on-new         exit 3 if any new finding vs --baseline (CI merge gate)

CI integration (with --mode ai/agent/both):
  --sarif               write SARIF 2.1.0 for GitHub code-scanning
  --pr-comment          write a markdown summary for a pull-request comment

Performance:
  --jobs N              parallelise the AI audit across N processes (or 'auto'
                        for all CPUs). Big speed-up on large scans; default 1.

Cron / alerting:
  --quiet               errors only
  --fail-on-critical    exit 3 if any agent-scan CRITICAL file
  --fail-on-ai N        exit 3 if AI%% >= N
  -h, --help

Stopping a run:
  Press Ctrl-C (or send SIGTERM) to terminate cleanly. The scan stops within a
  second, prints a notice, and discards partial results — nothing is written
  (the engine's run rolls back; reports/DB are written only on completion).

Exit codes: 0 ok · 2 usage/error · 3 threshold/new-finding tripped · 130 terminated by usercodedelta /src/old /src/new \
--metric-set "SLOC,LLOC,CHG_LLOC,ADD_LLOC,CRN_LLOC,CHG_FILE,CRN_FILE" \
-o management_report.html \
--csv management_report.csvCodeDelta is built on 20 years of expertise in code-churn measurement across huge legacy codebases deployed globally. Its core purpose is to measure changed, added, and deleted SLOC and LLOC across massive, multi-language projects — and that is where its proven value lies.
It seemed natural to extend this into the emerging area of AI-generated-code and AI-agent detection. We researched this seriously, using both a heuristic approach — GSS (Generation Signature Scoring) — and a more sophisticated machine-learning approach — MLS (Machine Learning Scoring) — the latter trained on datasets of known AI- and human-written code.
Our honest finding: AI-generated code can be detected only unreliably. It is possible to identify signals and properties that suggest code was AI-generated, but no technique we assessed does so dependably. In particular, if a developer instructs an AI to write code in the style of a human, every detection method we tried or uncovered proved ultimately unreliable. The differences that remain detectable are largely cosmetic — commenting and formatting habits — which are easily changed and are not proof of authorship.
For that reason, the AI Scan is a pointer toward code that may warrant a closer look — nothing more. It is not a determination of authorship, and it carries a meaningful false-positive rate on code unlike its reference data. Treat every flag as a prompt to review, never as evidence.
We also added a churn metric, Replacement Churn, on the observation that AI tools often delete and replace whole blocks rather than editing in place. This too is only a pointer: it reflects a workflow pattern, not authorship, and as AI tooling shifts toward in-line editing the signal is likely to weaken. It is a useful hint, not a measure of AI code.
The one component that detects something concrete is the Agent Scan, which identifies calls to known AI-agent frameworks and SDKs — because those are real, named artifacts in the code rather than statistical guesses.
In short: the AI element is provided free of charge, as an experimental extra, offered honestly for what it is — a set of pointers, not verdicts. Because it is included at no additional cost and makes no claim to reliable or definitive AI detection, it should not be regarded as a paid feature or relied upon as one. We genuinely welcome feedback on whether the AI features are useful to you and how they might be improved.
By contrast, CodeDelta's churn engine — the measurement of SLOC and LLOC change across versions — is the product's mature, dependable core, refined over two decades and trusted on large-scale legacy systems worldwide. The churn engine is the product you are purchasing; the AI features are a complimentary (no-cost) addition to it.
CodeDelta detects AI-generated code via two complementary scans:
The AI Audit mode in the GUI runs BOTH scans in a single pass, producing two separate HTML reports (codedelta_ai_code_scan.html and codedelta_agent_scan.html).
Each file receives a Generation Signature Score (GSS) from 0 to 100. The score is the weighted sum of several signals. A high score indicates the file exhibits many of the structural patterns associated with AI-generated code. A low score does not prove the code is human-written — it means no unusual patterns were detected.
| Signal | Weight | What it detects |
|---|---|---|
| Structural uniformity | 40 | Many repeated function bodies in one file. Strong signal — humans parameterise repeated logic, AI/generators produce N copies. New in v1.5.0. |
| Docblock coverage | 40 | Unusually uniform documentation — every function has a structured docblock |
| Guard clause density | 35 | High ratio of defensive checks (null checks, boundary guards) to total code |
| Formulaic exceptions | 30 | Exception messages that follow predictable patterns ("Invalid X: must be Y") |
| Audit/notify coupling | 25 | Logging calls systematically paired with operations |
| Annotation saturation | 20 | High density of decorators, attributes, or annotations |
| Zero inline comments | 10 | No // inline comments despite high docblock coverage |
| High add velocity | 15 | Large newly-added files with no history of incremental change |
| LLOC warning | 15 | SLOC/LLOC ratio anomaly suggesting unusual formatting |
The score used for classification is AIC where an ML model exists for the file's language, and GSS alone otherwise. Languages without an ML model are capped at ELEVATED — the heuristics can never declare HIGH without ML confirmation. (The single exception: a user-defined custom pattern with the override flag forces HIGH.)
| Rating | Rule | Meaning |
|---|---|---|
| HIGH | score ≥ threshold + 20 (ML-supported languages only) | Strong AI-generation characteristics — review first |
| ELEVATED | score ≥ threshold | Enough signals to warrant review |
| NORMAL | score < threshold | Below the review line at this sensitivity |
Sensitivity excludes and includes nothing. Every file is always scanned, every signal always computed, and the ML model always runs — a file's scores are identical at every setting. The slider only moves the two classification lines drawn over those fixed scores:
| Rating | Rule | Strict (30) | Balanced (50) | Conservative (70) |
|---|---|---|---|---|
| HIGH | score ≥ threshold + 20 | ≥ 50 | ≥ 70 | ≥ 90 |
| ELEVATED | score ≥ threshold | ≥ 30 | ≥ 50 | ≥ 70 |
| NORMAL | below threshold | < 30 | < 50 | < 70 |
Two useful corollaries. First, the flagged sets nest: everything flagged at Conservative is also flagged at Strict — lowering the threshold only adds files further down the ranking; it never changes any file's score. Second, because the report embeds source evidence for every flagged file, stricter settings produce larger reports and longer report-generation times.
GSS was validated against two corpora. A set of 26 human-written C++ files produced a mean score of 0.0 with no HIGH ratings. A set of 12 AI-generated files across multiple languages produced a mean score of 48.9 with 2 HIGH and 3 ELEVATED ratings. Zero false positives were observed on the human corpus.
GSS measures patterns, not intent. A highly disciplined human developer who writes uniform docblocks and systematic null checks will score higher than average. The score is a signal for review, not a determination of authorship. It is most useful when scores are unexpectedly high for files in a codebase where the baseline is known.
When the ML plug-in is installed, the AI Code Scan report shows two additional columns alongside GSS:
| Language | GSS | MLS | Notes |
|---|---|---|---|
| Python | ✓ | ✓ (83%) | Original ML model |
| C / C++ | ✓ | ✓ (99%) | |
| Java | ✓ | ✓ (99%) | |
| C# | ✓ | ✓ (97.5%) | New in v1.7.0 |
| JavaScript / TypeScript | ✓ | — | ML model planned for v1.8 |
| Go | ✓ | — | ML model planned for v1.8 |
| Other languages | ✓ | — | GSS-only scoring |
When MLS is unavailable for a language, the AIC column shows — and risk classification uses GSS alone. All other functionality is unaffected.
Files are placed into risk bands based on the AIC score (or GSS where MLS is not available):
| Band | AIC | Meaning |
|---|---|---|
| HIGH | 50+ | Strong evidence of AI generation. Review the file. |
| ELEVATED | 30–49 | Several signals present. May warrant review depending on context. |
| NORMAL | <30 | No unusual patterns detected. |
AI% is the headline project-level number on the AI report and GUI. It is the proportion of code, measured in lines, that sits in files flagged HIGH or ELEVATED:
So “AI% = 29” means 29% of the codebase, by lines, lives in files the scan flagged HIGH or ELEVATED — in a snapshot, 29% of total source lines are in HIGH/ELEVATED files.
It is not a claim that 29% of the code was written by AI, and it is not a probability or confidence score. It is a coverage measure — how much of the codebase, by volume, sits in files worth a closer look. Flagging means a file “shows characteristics associated with AI generation,” which CodeDelta treats as a pointer for review, not a verdict on authorship. Whole files are flagged or not; AI% is the line-share of the flagged ones.
The AI Detection Settings card on the Run Analysis page (visible in any AI Audit or AI Code Scan mode) opens a configuration dialog where you can fine-tune detection per language. The card's status line shows "X/Y signals active · N custom patterns" — a quick view of how much of the default scoring is in effect.
The dialog has six tabs: C/C++, Java, Python, C#, JavaScript, Go. The tab bar is sticky — it stays visible as you scroll through long signal lists.
Each language has a set of built-in signals. You can toggle individual signals on or off. This matters because some signals are context-dependent:
Signal configuration is saved to ml_config.json in the CodeDelta directory and takes effect on the next analysis run.
Add patterns specific to your codebase. Four pattern types:
# AI-generated.(?i)auto.?generated./generated/ or _ai.py.Each custom pattern can be set to Override — when the pattern fires, the file is always rated HIGH regardless of the ML score. Use this for definitive markers in your codebase.
Custom patterns apply across all AI Code Scan and AI Audit runs until removed. Saved to ml_config.json.
In plain terms: Agent Scan finds the files that actually use AI — code that calls or runs an AI model while your program runs (for example, importing an AI library or sending it a prompt). It answers one question — "does this code talk to AI?" — not "was this code written by AI?" (that's the AI Code Scan). It flags where AI is wired into your software and highlights the riskier uses.
code-delta-app/demo repository into a private folder
(~/.codedelta/demo-code) when you press its Download button,
scans it locally, and keeps it until you press Delete. The
Churn Demo compares one small Account class across seven languages over two
versions. The Agent Scan Demo scans a small project full of embedded AI usage
(SDK imports, agent orchestration, exec on model output, raw API endpoints,
non-Western SDKs) plus one clean control file — the files are synthetic and never executed,
antivirus tooling may flag them, which is expected, and that download asks for your
confirmation first. View demo code opens the sample's source so you can check
every figure and flag against it. From a terminal the same scans are:
python3 codedelta_server.py scan <folder>/churn-demo/new <folder>/churn-demo/old --mode churn --html
python3 codedelta_server.py scan <folder>/agent-scan-demo --mode agent --html
README.md.
The Agent Scan analyzes source files for code that initiates AI agents at runtime — code that imports AI SDKs, orchestrates agents, executes dynamic code, or constructs prompts from user input. This is entirely distinct from the AI Audit: Agent Scan detects code that runs AI agents, not code that was written by AI.
Agent Scan reads each source file and looks for four categories of pattern using regular expression matching. Each pattern category carries a weight. Files whose total weight exceeds the configured threshold are flagged.
The scan is entirely static — it reads source text only and never executes any code. It works on files even when dependencies are not installed.
Every file starts at an Agent Initiation Score (AIS) of 0. Signals add points, capped at 100. The table below is the complete, current scoring model — there are no other inputs, and no randomness: the same file always produces the same score.
| Signal | Points | What it detects |
|---|---|---|
| AI SDK import | +40 | An import of a recognised AI SDK or framework — the full, current list is in “Recognized providers & extending the list” below (plus anything you add via codedelta_agents.json). |
| Known model endpoint | +40 | A raw HTTP call to a recognised model endpoint (api.openai.com, bedrock-runtime, api.deepseek.com…) with no SDK import — language-agnostic, comments stripped first. |
| Agent orchestration | +40 | Invoking agent behaviour, not just importing it: Agent(, AgentExecutor(, chain.invoke( and similar. |
| Hand-rolled agent loop | +40 | An AI API call inside a loop — a self-driving agent pattern without a framework (also raises the separate cost-risk flag). |
| Rogue pattern | +70 | eval/exec near an AI API call — model output executed as code. Rated CRITICAL regardless of everything else. |
| Dynamic execution (plain) | +50 | eval(/exec( in Python (in Java/C++/JS these are ordinary identifiers and are deliberately not flagged). |
| Indirect execution | +50 | Aliased or obscured exec access — getattr, globals() dictionary tricks. If an AI call is anywhere in the file this also counts as the rogue pattern. |
| Shell execution with variables | +40 | subprocess/shell invocations built from variables — a command-injection vector. |
| Dynamic import | +20 | Runtime module loading (__import__ and kin). |
| Prompt-injection vectors | +18 / +35 | Unsanitised user input interpolated into prompts: one or two occurrences +18, three or more +35. |
| Obfuscated code | score raised to at least 70 | A JavaScript or Python file with 50 or more machine-generated names of the form _0x1a2b — the signature of an obfuscator, rated HIGH. Measured 6 October 2026: five hijacked npm releases each carried 3,235 such names in one file and a hijacked PyPI release 576,857, while their clean predecessors had none; across 142 clean public packages no file had more than 3. It does not catch malicious code written in plain form, and an attacker can avoid the signature — a pointer for review, like the rest of Agent Scan. |
Three fixed cut-offs, applied to the capped score, and one rule above them:
| Rating | Rule | What it means in practice |
|---|---|---|
| NORMAL | AIS < 40 | No AI-agent initiation signatures. |
| ELEVATED | AIS ≥ 40 | “This file uses AI.” Any single AI signal lands exactly on 40 by design — ELEVATED carries no judgement beyond that fact. |
| HIGH | AIS ≥ 70, or eval/exec combined with an AI SDK | “This file uses AI in a way that can execute or be steered” — either the one genuinely dangerous construct, or two signals compounding. |
| CRITICAL | The rogue pattern, unconditionally | “This file runs what a model tells it to” — the most serious thing the scanner detects. |
CRITICAL is the top tier and only the rogue pattern reaches it (since 7 September 2026). Data-sovereignty, cost-risk and agent-artifact findings are reported alongside but deliberately do not move the AIS — they are compliance information, not initiation evidence.
The most serious finding is the Rogue Agent pattern: a dynamic code execution call (eval, exec, or subprocess) that appears within 10 lines of an AI API call. This pattern indicates code where an AI model's output may directly influence what gets executed on the host machine — a significant and specific security risk.
A file flagged for the Rogue Agent pattern is rated CRITICAL regardless of its total score.
Example of Rogue Agent pattern:
response = client.chat.completions.create(...)   # AI API call
code_to_run = response.choices[0].message.content
exec(code_to_run) # within 10 lines — ROGUE AGENTThe Agent Scan demo (Try It — Demos → Agent Scan Demo) holds two pictures in
helpdesk/assets/. badge.png is a plain image. banner.png looks the same
in any image viewer, but a few lines of Python have been added after the picture data: they ask a model for its
next step and run the reply. A reviewer sees a logo change; the agent code rides along unseen.
Agent Scan reads every file. For an image it pulls out the readable text and runs the same rules over it, so:
| File | Level | Rating | Why |
|---|---|---|---|
helpdesk/assets/banner.png | binary (.png) | CRITICAL (AIS 100) | code found in the printable text of a binary file; an AI SDK import; the reply executed next to the model call (the Rogue Agent pattern) |
helpdesk/assets/badge.png | binary (.png) | NORMAL | nothing hidden in it |
View Source on banner.png shows its readable text, with the hidden lines at the end and the
exec line marked. The same check runs on every file that is not text: PDFs, archives, executables
and model files.
A file that scores HIGH on both GSS (appears AI-generated) and AIS (initiates AI agents) receives a CRITICAL rating. This is the highest-risk scenario: code that nobody may have fully reviewed or understood, which autonomously initiates AI agents at runtime.
The Agent Scan report includes an inline source viewer. Click View Source on any flagged file to see it with dangerous lines highlighted:
When AI SDK imports are found, the Agent Scan report includes an SDK Inventory — a list of each recognized AI framework detected and the number of files importing it. This gives a quick overview of which AI dependencies are present across the codebase.
Beyond which AI a file uses, Agent Scan flags two things that matter to compliance and budget owners, rolled up in a Governance & Compliance panel at the top of the report:
dashscope, Zhipu, ERNIE/qianfan, Moonshot). Per-file signals: data_egress(model_hosted_in_<country>:<host>) and data_sovereignty_risk(non-allied_jurisdiction).cost_risk(ai_calls_inside_loop).Both are informational compliance/cost flags — they do not change a file’s AIS risk score. Endpoint matching ignores comments and docstrings, so a hostname that appears only in a comment is not flagged.
From the command line, Agent Scan can export an AI Bill of Materials — a machine-readable inventory of every AI provider the code touches, with jurisdiction, file usage, and the risk / cost / sovereignty flags:
python3 codedelta_server.py scan ./src --mode agent --bom ai-bom.json
python3 codedelta_server.py scan ./src --mode agent --bom ai-bom.json --bom-format cyclonedx
Two formats: native (CodeDelta-AI-BOM, the richest) or cyclonedx (CycloneDX 1.6 — SDK libraries become components, model endpoints become services with an outbound “prompt” data flow, for existing SBOM tooling).
The same data drives a CI policy gate. --gate fails the build (exit code 3) on the default policy: any egress to a non-allied jurisdiction (CN/RU/KP/IR) or the rogue exec-on-model pattern. --gate-policy policy.json uses your own rules and implies the gate:
{
  "deny_jurisdictions": ["CN", "RU"],
  "allow_providers": ["openai", "anthropic"],
  "deny_flags": ["rogue_pattern", "cost_risk"],
  "max_risk": "ELEVATED",
  "fail_on_agent_artifacts": true
}
Each violation is listed and the process exits non-zero, so it drops straight into a CI step (the gate needs an Agent Scan: --mode agent, both, or ai_audit).
Agent Scan ships with a broad built-in list of AI SDKs and frameworks — OpenAI, Anthropic, Google, Cohere, Mistral, LangChain, CrewAI, AutoGen, and many more, including enterprise cloud routes (AWS Bedrock, Azure OpenAI), Model Context Protocol SDKs (mcp, fastmcp), and non-Western providers such as DeepSeek, Alibaba Qwen (dashscope), Zhipu GLM (zhipuai), Baidu ERNIE (qianfan), Moonshot Kimi, Sber GigaChat and YandexGPT. It also detects raw HTTP calls to known model endpoints (e.g. api.openai.com, bedrock-runtime, gigachat.devices.sberbank.ru) even when no SDK is imported.
You can extend detection without waiting for a release. Drop a codedelta_agents.json file in your application-support folder (or next to the engine, or your project root) to add your own AI SDK import names and API endpoints — useful for internal AI wrappers or private gateways. It is additive on top of the built-ins:
{
  "providers": [
    { "name": "Internal LLM", "lang": "python",
      "imports": ["acme_llm"], "endpoints": ["llm.acme.internal"] }
  ],
  "artifacts": [
    { "name": "AcmeAgent", "tier": 3,
      "paths": ["acme-agent/", "acme.agent.key"] }
  ]
}
The artifacts array adds your own entries to the Agent Infrastructure scan (next section): a trailing slash means a directory name, otherwise a file name.
Alongside detecting code that calls AI, Agent Scan inventories agent infrastructure committed to the tree — the files AI agents leave behind, evidence that an agent operates on this repository. The scan walks the full tree (including dot-directories the source scan skips), is deterministic, and reports every hit as a named path. Findings appear in the Agent Infrastructure section of the agent report and as agent_artifacts entries in the AI-BOM. They never change any file’s risk rating.
| Tier | Meaning | Examples |
|---|---|---|
| 1 — informational | Sanctioned agent-assisted development; shown as a count only. | CLAUDE.md, AGENTS.md, .cursorrules, Copilot instructions |
| 2 — notable | Agent runtime or configuration — an agent runs against this repo. | .claude/ workspace, MCP configs (.mcp.json), aider config/history |
| 3 — review | Rogue-agent residue or committed agent credentials; listed with full paths. Credential files carry a note saying whether they hold a token-shaped value or are an empty placeholder. | openclaw/, clawdbot/, moltbot/ directories; gateway.auth.token |
Tier 3 findings are reported, never build-failing, by default — many teams run agents such as OpenClaw deliberately. To make the CI gate fail on them, set "fail_on_agent_artifacts": true in your --gate-policy JSON. Artifacts flow through every headless output too: the console prints a per-run artifact line, --csv appends ARTIFACT rows after the per-file rows, --json carries an agent_artifacts block, and the AI-BOM and SARIF outputs include them. As everywhere in Agent Scan: pointers for review, not verdicts.
When the scanned folder is a git repository, the Agent Scan report adds a
Git History Evidence section — commits carrying verifiable agent
signatures: Co-Authored-By trailers (Claude Code, GitHub Copilot, Cursor,
Aider, and others), generation footers, and agent bot accounts. Unlike the pattern-based
scans, this is documentary: a match proves an agent participated in that commit. The
reverse does not hold — signatures can be stripped or never written, so the absence of
evidence proves nothing. The section shows the share of agent-signed commits, a breakdown
by agent, the most recent signed commits, and the files most often touched by them.
In batch mode the raw data also exports as *_git_evidence.json.
New in v1.8.2.
Every agent report also watches the files that control how the project builds and
ships. A change to build machinery can alter the shipped artifact without touching
application source — the mechanism behind supply-chain backdoors such as xz-utils,
where the payload entered through an autoconf .m4 file rather than readable
source. Two tables cover it:
Build Files Changed In This Diff — the change alert, shown whenever
the scan compared two versions. Of the files that control how the project builds and ships,
these differ between old and new. It is computed with no ML and no scoring — pure
determinism: both directory trees are walked and every filename is checked against a rule
table (exact names like Makefile, Dockerfile,
package.json; tell-tale suffixes like .m4, .spec;
locations like .github/workflows/ where a yml file is executable CI). Each
recognised file gets a category — build definition, CI/CD, packaging, dependency
manifest. Then the two lists are compared: in new only = ADDED, in old only
= DELETED, in both = the bytes are compared and if they differ =
MODIFIED. The count in the title is the red-alarm entries; dependency
manifests sit in a quieter line below because they change constantly and red-flagging them
would desensitise the alert.
Build & Deployment Surface — the presence inventory: what build machinery exists in the scanned tree, changed or not, in the same categories. It renders in every agent report, snapshot or pair.
Install / build hooks head both tables regardless of category.
package.json and setup.py are read and checked for install-time
execution (a postinstall script, a cmdclass override) — code
that runs the moment someone installs the package, the classic supply-chain vector.
Where each appears, by scan mode — the change alert follows churn (it needs two versions); the presence inventory follows the agent scan (it describes one tree):
| Mode | Change alert (“changed in this diff”) | Presence inventory (“what exists”) |
|---|---|---|
| Churn | ✓ GUI box + CLI [build] lines | — |
| Churn + Agent Scan | ✓ + agent report + PR comment | ✓ |
| Both (churn + AI + agent) | ✓ + agent report + PR comment | ✓ |
| Agent Scan only | — (no pair) | ✓ |
| AI Audit | — (no pair) | ✓ |
| Metrics + Agent Scan | — (no pair) | ✓ |
| AI Code Scan | — | — |
| Metrics | — | — |
Every scan that compares two versions carries the change alert; no snapshot scan does (the single-project modes deliberately run the engine with old = new, so there is nothing to diff). A churn-only scan shows the alert in the GUI and CLI output but not in an HTML report — the section lives in the agent report, and churn-only does not produce one. A pair where no build file changed shows an explicit grey “no build-file changes” line, so an empty result never looks like a missing feature. As everywhere in CodeDelta, this is a pointer for review, not a verdict — it flags that the build machinery changed, not whether the change was malicious.
What Agent Scan cannot detect:
requests.post("https://api.openai.com/...") without importing the openai SDK, Agent Scan will not flag it.import openai as ai_lib may not match all detection patterns depending on subsequent usage.Agent Scan will produce false positives in some situations:
tests and test directories.The source viewer is the most effective tool for investigating potential false positives — it shows exactly which lines triggered each flag.
Agent Scan reads every file, at one of four levels, and every result names the level it got.
Full language rules — AI SDK imports, model calls, agent frameworks and loops, and a process launch or code evaluation near a model call (CRITICAL) — in C, C#, C++, Dart, Elixir, Go, Groovy, Java, JavaScript, Julia, Kotlin, Lua, Perl, PHP, PowerShell, Python, R, Ruby, Rust, Scala, Swift and TypeScript; also the script blocks of Astro, HTML, SVG, Svelte and Vue files (as JavaScript) and the code cells of Jupyter notebooks with a Python kernel (as Python).
Endpoint level — model endpoints, encoded payloads and the language's own launch and eval calls, with no SDK table — in shell scripts, CI recipes, Dockerfiles and Jenkinsfiles, Objective-C.
Text level — model endpoints and encoded payloads, plus Markdown code blocks that would rate HIGH or CRITICAL under their language's rules; ELEVATED at most — for every other readable file up to 2 MB. Section 01's language table gives the level per extension.
Binary level — every other file: images, PDFs, archives, executables, model files, and text files over 2 MB. Its readable text is pulled out the way strings does and the endpoint, encoded-payload and language rules run over it; code found there is reported as hidden in a binary file, with no ceiling, so hidden code that runs a model's reply is CRITICAL. In a large file the start and the end are read.
Hidden folders are read too (agent settings live in .claude, .vscode and the like). Not entered: __pycache__, .cache, .git, .gradle, .hg, .mypy_cache, .next, node_modules, .nuxt, .pnpm-store, .pytest_cache, .ruff_cache, .svn, .terraform, .tox, vendor, .venv and .yarn (dependencies, version control, virtual environments and tool caches), and dist unless --include-dist is given.
The Threat Index compares the two versions of a project and asks one question: what in this change looks like an attack? It answers in a few plain lines, each with its numbers. It grew out of the paper The change is the threat: in the hijacked package releases measured there, five libraries each gained the same obfuscated line in their main file while the rest of the release barely moved. The Threat Index finds that shape without anyone having to look for it. Its findings are pointers for review, not verdicts.
When it runs: automatically in every mode that compares two versions — Churn, Churn + Agent Scan, and Both — when the old and new folders differ. A single-folder run has no “before”, so nothing in it counts as added and the Threat Index does not run.
| Level | When |
|---|---|
| Advisory | The same newly added code — a line of 200+ characters, or a block of 5+ lines and 200+ characters — appears in 3 or more files; or one added line is 5,000+ characters long. Often harmless (a helper pasted into several modules). The same image data added to many files is reported as an image and is never more than Advisory. |
| Attention | That repeated code is also obfuscated (50+ machine-generated _0x… names), decodes to a program, or is rated HIGH or CRITICAL by the Agent Scan; or obfuscated code is added to any file; or a new file of 200+ lines arrives in a release that otherwise barely moved (at most 3 existing files changed, gaining at most 60 lines). A file moved from elsewhere in the project is not counted as new. |
Not counted: lock files, minified and source-map files, the folders the Agent Scan skips, binary files, files over 8 MB, comment-only blocks and whitespace-only changes.
Where it appears:
<name>_threat_index.html (and .json with --json) beside the other reports.The Threat Index reports only: it never changes the exit code or blocks a merge.
Every coding agent writes a session log of what it did on the machine it runs on: the human’s prompts, every tool call with its arguments, every result, the model in charge, and the timestamps. The AI Agent Tracer reads those logs after the fact and produces one report of what the agents actually did. It runs offline and sends nothing anywhere. It is the Agent Scan’s idea pointed the other way: the Agent Scan reads source code for agent code; the Agent Tracer reads what an agent did.
| Agent | Where its logs live |
|---|---|
| Claude Code | ~/.claude/projects/<project>/<session>.jsonl (sub-agent transcripts under <session>/subagents/ are folded into the session) |
| OpenAI Codex | ~/.codex/sessions/YYYY/MM/DD/rollout-*.jsonl |
| Cursor | ~/.cursor/projects/<workspace>/agent-transcripts/<id>/<id>.jsonl; the model name comes from Cursor’s own database |
| GitHub Copilot CLI | ~/.copilot/session-state/<id>/events.jsonl |
| Gemini CLI | ~/.gemini/tmp/<project>/chats/session-*.jsonl |
| Google Antigravity | ~/.gemini/antigravity/conversations/<id>.db |
The format is detected per file. Leave the folder field empty and the Tracer reads this machine’s own logs from all six locations; point it at a folder and it reads whatever session logs are inside, however deep, including hidden folders — so a folder of logs collected from a team’s machines reads the same way.
scan <logs-folder> --mode tracer --out-dir <dir> writes codedelta_agent_tracer.html and three CSVs (findings, sessions, sub-agents) into the output folder.Each run is compared with the previous one: the report leads with a Since last run block — new sessions with what each was asked, hosts contacted for the first time, new findings of the kinds that matter, ratings raised — and then rewrites the baseline for next time. The app keeps its baseline beside its database; the command line keeps agent-tracer-baseline.json in the output folder. A quiet week is a few lines.
The agents own their logs and delete or rewrite them on their own schedule, so a Tracer run can never see
further back than the agents keep. The log keeper copies this machine’s agent logs, on a
schedule you choose, into a folder you control — a folder directly in your home folder (e.g. ~/tracer logs),
which your normal backup then covers. Protected folders cannot be used: on macOS the keeper refuses
Desktop, Documents, Downloads, iCloud Drive and cloud-storage folders (OneDrive, Google Drive, Dropbox, Box), because
the operating system blocks the automatic copy there; on Windows it also refuses Pictures, Music, Videos, Favorites
and OneDrive, which Controlled folder access guards when it is switched on. It copies only what is new or changed, never touches the agents’
own files, and never deletes anything from the keep folder: a log the agent later removes stays kept.
scan <keep-folder> --mode tracer-keep [--compact] [--no-compress] — the
same command the scheduled job runs. Install the job with --install-at-login [--delay M]
or --install-nightly [--at HH:MM]; remove it with --remove-nightly..jsonl.xz) and read directly; a manifest beside them records each file’s original
size and SHA-256 so a kept log can be shown unaltered.Every keep also counts the tokens the agents used, from the kept logs of every machine in the keep folder, and compares them with budgets you set. It watches and reports; it limits nothing.
codedelta-token-consumption.html
(Token report), codedelta-token-consumption.csv (one row per budget) and
codedelta-token-usage.csv (one row per day, machine and project). Dates are UTC.Tiles for sessions, commands run, destructive commands, publishes, hosts contacted and calls the human refused. A filter bar (agent, model, rating, project, dates, free text). A signals table with every rule stated in words. A sessions table — date, agent, model, project, the first thing the human asked, minutes, prompts, commands and each signal’s count — where clicking a row lists every call behind its numbers, with the model in charge and a sub-agent tag where one applied. A models table (turns, sub-agent turns, commands, reads, edits, web fetches, signal counts per model). A sub-agents table (the brief each was given, its calls, what it reported back). Hosts contacted, hosts merely named in text, and the refused calls. Credential values are masked everywhere.
| Signal | What counts |
|---|---|
| Destructive | rm with -r or -f, git reset --hard, git clean, git checkout --/restore over working files, force push, pkill, kill -9, DROP TABLE; also a file removed by an agent’s own delete tool |
| Publishing | git push, releases, pull-request writes, version tags, npm publish, scp/rsync to a remote host |
| Network | a shell segment running curl, wget, ssh, scp, rsync, nc, gh api, or a package install of a named package (a local pip install -e . is not); the hosts reached are listed, with the country where the Agent Scan’s provider table states it |
| Privilege | a command segment starting with sudo, world-writable chmod, launchctl, keychain access, Gatekeeper or quarantine changes |
| Dynamic execution | an interpreter fed code written in the same turn: python -c, heredocs into an interpreter, eval, piping into a shell |
| Credential text | a token, password, secret, key or authorization header given a value, a private-key file, or a string shaped like a known secret — in a command or a prompt; the value is masked |
| Outside the project | a path under Downloads, Documents, Library, .ssh, .aws, /etc, /Applications or the like, named in a command or written to |
| Refused / stopped / blocked | a call the human turned down at the permission prompt; a turn the human interrupted; a call stopped by a hook or policy rather than the human |
| Repeated | the same command run three or more times in one session |
Rating rule. CRITICAL: a privilege command, or credential text in a command that also reaches the network, or a destructive command whose own line names a path outside the project. HIGH: any destructive or publishing command. ELEVATED: network, dynamic execution, a write outside the project, or a refused call. NORMAL: none of those. The same four words as the Agent Scan; a rating says a person should look, not that harm occurred — the calls behind every number are one click away.
The rules are pattern matches: a force push to a private branch and a force push to main both count. The task line is the first prompt of a session. Text the tool injects as a “user” message (skill files, slash-command output, compaction summaries) is not counted as a prompt. Logs live on developers’ machines and Claude Code deletes its own after thirty days by default; collecting them for a team is a matter of the agents’ own settings and hooks, not of this tool. Nothing here reads a vendor’s servers.
CodeDelta integrates with any CI/CD system or version control system that can export source files to a local directory. It does not interface directly with any CMVC system — it requires plain directory copies of your source.
Use --threshold-churn <n> to fail the build if CRN_LLOC exceeds a threshold. Exit code 2 means the threshold was exceeded.
stage('Code Metrics') {
  steps {
    sh """
      codedelta ${WORKSPACE}/old ${WORKSPACE}/new \
        --project "${JOB_NAME}" \
        --old-label "${OLD_TAG}" \
        --new-label "${NEW_TAG}" \
        --snapshot-date "${BUILD_DATE}" \
        --exclude "vendor,tests" \
        -d ${WORKSPACE}/codedelta.db \
        -o ${WORKSPACE}/report.html \
        --threshold-churn 10000 -q
    """
  }
}- name: Run CodeDelta
run: |
codedelta ./old ./new \
--project "${{ github.repository }}" \
--old-label "${{ github.event.before }}" \
--new-label "${{ github.sha }}" \
--snapshot-date "$(date +%Y-%m-%d)" \
--exclude "vendor,node_modules" \
-o report.html --csv report.csv -qThe engine also ships as a public container image —
ghcr.io/code-delta-app/codedelta, republished with every release — which is
the easiest route in CI systems other than GitHub Actions: nothing is installed on the runner.
The licence rides in as an environment variable (CODEDELTA_LICENSE_B64, the base64
of your codedelta.lic) or a mounted file; all arguments pass straight to the
batch CLI described above.
docker run --rm -v "$PWD:/work" -e CODEDELTA_LICENSE_B64 \
    ghcr.io/code-delta-app/codedelta \
    scan /work/new /work/old --mode churn_agent --html --csv
In a Jenkins pipeline that command is a single sh step: store
the base64 licence as a secret-text credential, git worktree add the base branch,
scan workspace against base, and let exit code 3 (from --gate or
--fail-on-new) fail the stage. On Kubernetes, run the identical
image inside your CI agent pods, or as a scheduled CronJob snapshot scan with the
licence in a Secret and reports written to a volume. Copy-paste recipes for all three:
the CLI page and
Jenkins, Docker and Kubernetes — where
measurement fits.
The first scan of an established codebase flags many files at once, and most of them are pre-existing — not something the current change introduced. A baseline records the accepted current state so later scans surface only what got worse: files newly flagged, or flagged at a higher severity than before. This is what makes CodeDelta usable as a merge gate rather than a one-time audit. New in v1.8.2.
Accept the current state once and commit the baseline file to your repository:
python3 codedelta_server.py scan ./src --mode both \
      --write-baseline codedelta-baseline.json -q
Then, on every run (or every pull request), compare against it. Only files that
regressed are reported; --fail-on-new sets exit code 3 so a build can
block the merge:
python3 codedelta_server.py scan ./src --mode both \
      --baseline codedelta-baseline.json --fail-on-new -q
A finding counts as new when its risk exceeds its baselined level
(absent from the baseline counts as lowest, so genuinely new flags and
severity regressions both surface). Files that dropped below their baselined
level are reported as resolved — positive feedback, never a
failure. With --json, the comparison is also written to
*_baseline_diff.json. Re-run --write-baseline whenever
you want to accept the current state as the new normal.
The longitudinal database accumulates every run, which makes it the source for a one-page executive summary — the artifact you forward to whoever approves the purchase, rather than the detailed engineer's report. It shows headline numbers for the latest run, trend arrows versus the previous run, and inline charts of churn and AI% across recent runs. New in v1.8.2.
python3 codedelta_server.py trend codedelta.db \
      --out summary.html --project MyApp --limit 20
--project selects which project in the database to chart (defaults to the
one with the most runs); --limit caps how many recent runs are shown. The
page is self-contained HTML — no external libraries — so it emails and embeds cleanly.
Backfill historical points with --git snapshots (the commit date becomes the
run's date), then run trend to chart the whole release history at once.
The SQLite database (codedelta.db) accumulates every run. You can query it directly:
sqlite3 codedelta.db "
  SELECT r.run_at, rt.crn_lloc, rt.total_sloc
  FROM run r JOIN run_totals rt ON r.id = rt.run_id
  WHERE r.project_id = (SELECT id FROM project WHERE name = 'MyApp')
ORDER BY r.run_at DESC LIMIT 10;"| Table | Contents |
|---|---|
| project | Project names and creation dates |
| run | Each run: old/new dirs, labels, snapshot_date, exclude_dirs, note |
| run_totals | Project-level totals for every metric per run |
| file_metrics | Per-file metrics for every file in every run |
| metric_set | Named metric sets |
| metric_set_item | Metric codes belonging to each set |
Where it lives. The GUI uses a permanent per-user location that
survives reinstalls (~/Library/Application Support/CodeDelta/codedelta.db on
macOS, ~/.local/share/CodeDelta/codedelta.db on Linux,
%APPDATA%\CodeDelta\codedelta.db on Windows). The command-line engine
defaults to codedelta.db in the current directory — for cron jobs
always pass an explicit -d /path/to/project.db. The batch command line (scan, which the GitHub Action and the GitLab template run) never writes into the folder it scans: unless --db is given, its database goes in the output folder as <name>_run.db, and its Agent Scan skips CodeDelta’s own output. In WAL mode you will
also see codedelta.db-wal and codedelta.db-shm alongside it;
these are normal.
One database per project. Point each project at its own
.db. This keeps history clean and avoids write contention — two scans writing
the same database serialise (brief overlaps wait safely), but two long scans
against one shared database can time out the second writer.
Do not place a CodeDelta database on a network share (NFS, SMB/Windows file shares, some cloud-sync folders). SQLite's file locking is unreliable over network filesystems and can corrupt the file — this is a general SQLite limitation. Keep it on a local disk; if you need history on a server, run locally and copy the backup up.
How big it gets. Size grows with files × runs at roughly 0.4 KB per file per run (the per-file detail rows). A 4,000-file project is about 1.5 MB per run; a year of nightly runs is a few hundred MB. The project-level totals that trend reports read are tiny (one row per run), so trend and history queries stay fast no matter how long you keep the database. For very large projects kept for many years, you can prune old per-file detail while keeping the totals.
Backups. The database is a single local file with no built-in
replication, so back it up like any data you would not want to lose. Because of WAL mode,
do not just copy the live .db file — use SQLite's safe
online backup, which captures a consistent snapshot even while a scan is running:
# either of these produces a clean, single-file backup
sqlite3 /path/to/project.db ".backup '/backups/project-$(date +%F).db'"
sqlite3 /path/to/project.db "VACUUM INTO '/backups/project.db'"
Schedule that (e.g. a nightly cron right after the scan) and copy the backup to a
second location or offsite for redundancy. Integrity is protected at runtime by
write-ahead logging and atomic, all-or-nothing runs (an interrupted scan rolls back
cleanly and never leaves a half-written run); you can confirm a database is healthy any
time with sqlite3 project.db "PRAGMA integrity_check;".
CodeDelta ships an MCP server (codedelta_mcp.py, in the
install folder) so AI coding assistants — Claude Code, Claude Desktop, Cursor, and any
other Model Context Protocol client — can call the real engine instead of improvising
their own analysis scripts. The agent provides the conversation; CodeDelta provides the
deterministic, reproducible numbers. New in v1.8.2.
Register it with your agent. Claude Code example (claude mcp add or in
your MCP config):
{
  "mcpServers": {
    "codedelta": {
      "command": "python3",
      "args": ["/Applications/CodeDelta/codedelta_mcp.py"]
    }
  }
}
The server exposes three tools:
| Tool | What it does |
|---|---|
churn_scan | Engine churn measurement between two directories or two git refs (v1.7..v1.8); returns totals plus paths to the HTML reports |
agent_scan | AI-usage inventory: SDK imports, risk ratings, and git-history agent evidence |
ai_audit | AI-written-code audit (heuristics + ML); per-file ratings and AI% |
Once registered, asking your agent "how much churn between release 1.7 and
1.8?" or "does this codebase use AI agents?" invokes CodeDelta and cites
its numbers. Licensing is unchanged — the engine verifies codedelta.lic
locally no matter who calls it. Requires Python 3.8+ to run the server script.
CodeDelta uses the Myers diff algorithm for file comparison, which finds the shortest edit script between two files. This is more accurate than simple line-by-line comparison for files that have been significantly restructured.
Before running the full Myers diff, CodeDelta uses Jaccard similarity to detect file renames and large-scale moves. A file that appears deleted in the old snapshot and created in the new, but with high token similarity, is treated as a rename rather than a delete+add. This prevents inflated churn numbers from routine refactoring.
LLOC comparison works by tokenising each file's semicolon-terminated statements and running Myers on the resulting token stream rather than the line stream. This means a purely cosmetic reformatting — changing indentation, line breaks, or spacing within a statement — does not register as a change. Only actual logical changes increment CHG_LLOC.
PLOC counts lines beginning with # (after optional whitespace) in C/C++ and C# files. This includes all preprocessor directives: #include, #define, #ifdef, #ifndef, #endif, #pragma, #undef, #if, #else, #elif, #error, #warning. PLOC is included within SLOC and LOC — it is not subtracted, it is identified separately for clarity.
J_COM counts /** ... */ Java-style docblock comments. C_COM counts /* ... */ C-style block comments. EOL_COM counts // to-end-of-line comments. Every line a block comment spans counts as a comment line (a three-line /* */ comment is 3 in C_COM); the tool reports comment lines, not comments. COM_LOC = J_COM + C_COM + EOL_COM.
Single-quoted character literals are correctly excluded from LLOC counting. A semicolon inside a character literal — such as char c = ';' — is not counted as a logical statement. This applies to C/C++, C#, Java, and JavaScript. Escape sequences ('\\', '\n', '\0') are also handled correctly. This was a known limitation corrected in v1.4.1.
CodeDelta requires a valid license to run. Your license is a signed file named codedelta.lic, verified entirely offline — no license server, no internet connection needed. License types:
| Type | Duration | Use |
|---|---|---|
| Evaluation | Time-limited (typically 30 days) | Free trial |
| Corporate | Per agreement | Organization-wide, unlimited seats |
| Single-user | Per agreement | Locked to one named machine |
GUI: on first launch, the activation screen asks for your license — select the codedelta.lic file you were sent. It is saved to your application support folder and verified locally.
Command line: install the license file with:
./codedelta --activate /path/to/codedelta.licOr place codedelta.lic in any location the engine searches (first valid match wins):
CODEDELTA_LICENSE environment variablecodedelta binary~/.codedelta/For licensing, volume pricing, or academic licenses: codedelta.app
